
IB DP Biology 2025: Interacting Systems
C4.1 — Populations & Communities
Theme C: Interacting Systems · Standard & Higher Level
C4.1.1 & C4.1.2
Populations and Sampling
Key Understanding Populations are interacting groups of organisms of the same species. Their size is estimated using random sampling.
A population is defined as a group of organisms of the same species living in the same area at the same time. These individuals are capable of interbreeding and are effectively isolated from other populations of the same species. Since counting every single individual in a wild ecosystem is usually impossible due to time, resources, and the mobility of organisms, ecologists use statistical sampling techniques to estimate population sizes and density.
Population
Organisms of the same species living in the same area at the same time.
Sessile
Organisms that are fixed in one place; immobile (e.g., plants, barnacles).
Quadrat
A square frame used to isolate a standard unit of area for study of the distribution of sessile organisms.
Skill
Using random quadrat sampling to estimate population size for sessile (non-moving) organisms. It is vital that the sampling locations are entirely random to prevent sampling bias. The quadrats should also be representative of the entire study area.
1. Place a quadrat randomly in a defined area using a grid and random number generator.
↓
2. Count the number of individuals of the target species within the quadrat.
↓
3. Repeat this process multiple times and calculate the average number of individuals per quadrat.
↓
4. Multiply the average by the total area (divided by quadrat area) to estimate total population size.
C4.1.4
The Lincoln Index (Capture-Mark-Release-Recapture)
Key Understanding The Lincoln index is used to estimate the population size of motile organisms.
For animals that move (motile organisms), placing static quadrats is completely ineffective. Instead, ecologists use the Capture-Mark-Release-Recapture method. A portion of the population is captured safely, marked in a way that doesn't harm them or make them more visible to predators, and released back into the wild. After they have had time to fully mix with the uncaptured population, a second sample is captured. The proportion of marked individuals in the second sample is used to estimate the total population.
This method relies on several critical assumptions: the population is closed (no immigration or emigration), marking does not affect survival rates, marks are not lost, and marked individuals mix homogeneously with the rest of the population.
Skill: Calculate population size
Using the Lincoln Index formula.
$$N = \frac{n_1 \times n_2}{n_3}$$
- N: Total population estimate
- $n_1$: Number caught and marked in first sample
- $n_2$: Total number caught in second sample
- $n_3$: Number of marked individuals caught in second sample (recaptured)
C4.1.5 & C4.1.7
Population Growth Curves
Key Understanding Populations exhibit exponential and sigmoidal growth curves, controlled by carrying capacity and resources.
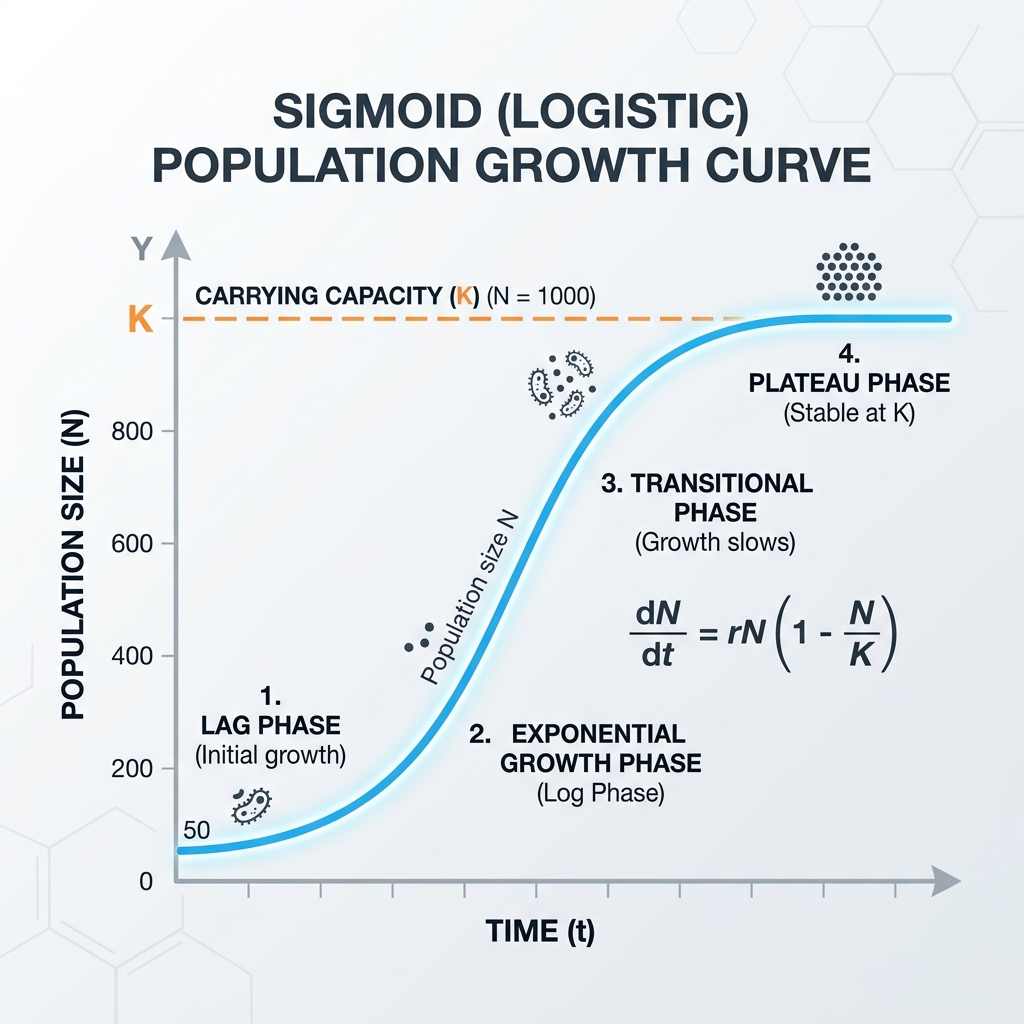
When resources are unlimited and environmental conditions are ideal, populations tend to grow exponentially (a J-shaped curve). However, in reality, resources are finite. As population size increases, environmental resistance (such as food scarcity, disease, and predation) increases. The population growth slows down and eventually stabilizes around the environment's carrying capacity ($K$), creating a sigmoid (S-shaped) curve.
Carrying Capacity ($K$)
The maximum population size that a particular environment can sustain indefinitely.
Exponential Growth
Growth whose rate becomes ever more rapid in proportion to the growing total number or size.
Application
Modeling sigmoid population growth curves. It features an exponential phase, a transitional phase (where growth slows), and a plateau phase (fluctuating around carrying capacity).
C4.1.9 & C4.1.11
Communities and Interspecific Relationships
Key Understanding A community consists of all the interacting organisms within an ecosystem.
A community is composed of multiple interacting populations of different species in a given area. Species within a community do not live in isolation; they interact in a multitude of ways. These interspecific interactions are fundamental in shaping community structure, biodiversity, and ecosystem dynamics. The ecological niche of a species—its role and position in the environment—is heavily influenced by these interactions.


| Interaction | Species 1 | Species 2 | Description & Example |
|---|
| Mutualism |
+ (Benefits) |
+ (Benefits) |
Both species benefit from the relationship. (e.g., Bees and flowers, clownfish and anemones) |
| Herbivory |
+ (Benefits) |
- (Harmed) |
An animal consumes plant material. (e.g., Caterpillar eating leaves, koalas eating eucalyptus) |
| Predation |
+ (Benefits) |
- (Harmed) |
A predator kills and consumes prey. (e.g., Lion hunting zebra, owl catching a mouse) |
| Parasitism |
+ (Benefits) |
- (Harmed) |
A parasite lives on or in a host, deriving nutrients at the host's expense. (e.g., Tick feeding on a dog) |
| Competition |
- (Harmed) |
- (Harmed) |
Organisms compete for the same limited resource, negatively impacting both. (e.g., Barnacles competing for rock space) |
C4.1.16
Predator-Prey Relationships
Key Understanding Predator–prey relationships serve as a key example of density-dependent population control.
Predator and prey populations often fluctuate in highly coupled, repeating cycles. As prey populations increase, predators have an abundant food source, leading to an increase in predator numbers. This higher predation pressure then causes the prey population to crash. With less food available, the predator population subsequently declines, which then relieves pressure on the prey, allowing them to recover, and the cycle repeats. The predator cycle typically lags slightly behind the prey cycle temporally.
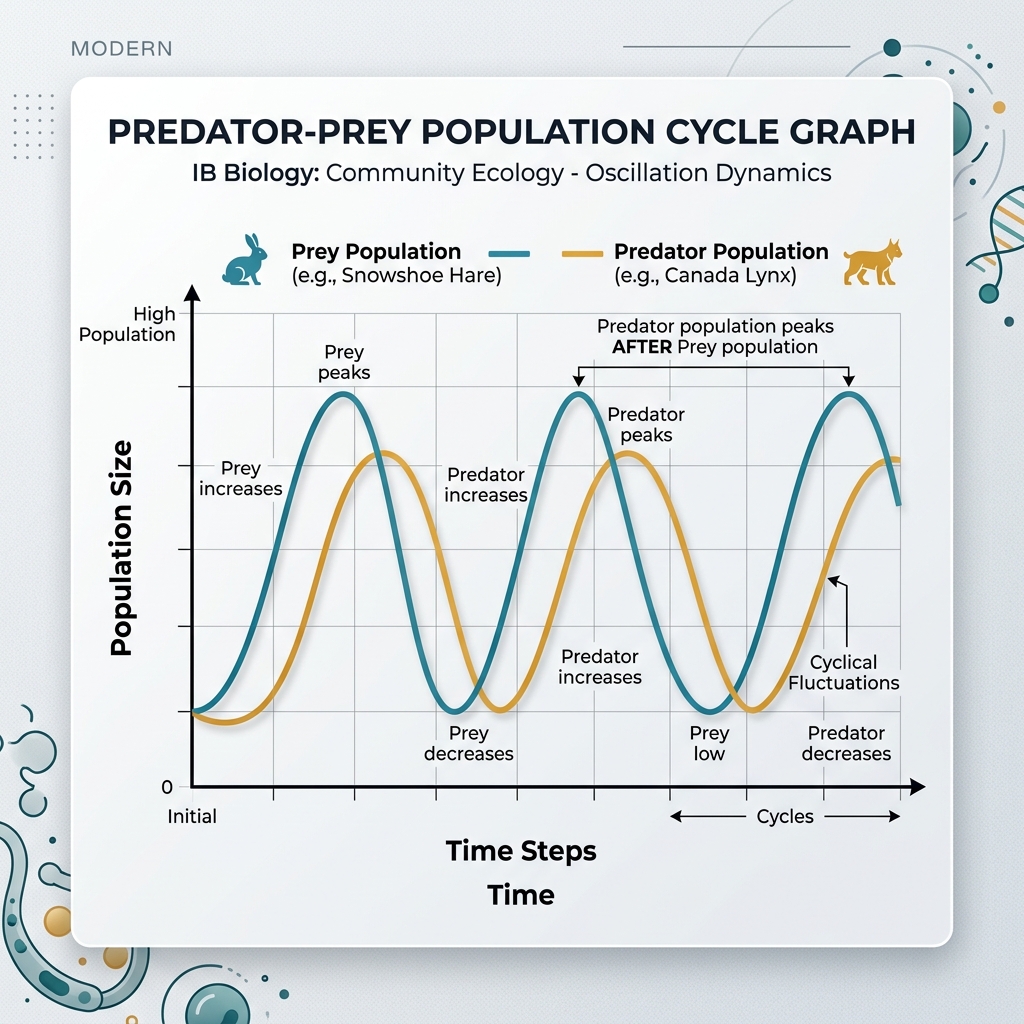
1. Prey population increases (abundant food for predators)
↓
2. Predator population increases due to more food availability
↓
3. High predation causes prey population to crash rapidly
↓
4. Less food causes predator population to decrease, allowing prey to recover
C4.1.17 HL Only
Top-Down and Bottom-Up Control
Key Understanding (HL) Community populations are regulated by either top-down or bottom-up control mechanisms.
Ecosystems are complex webs of interactions, but their overall structure and population dynamics are generally governed by forces originating from either the top of the food chain or the bottom. Understanding these mechanisms is crucial for ecosystem management and conservation efforts.
Top-Down Control
Population size and community structure are regulated by predation at higher trophic levels. The apex predators exert pressure downwards.
- Predators control herbivore populations, preventing them from overgrazing and destroying plant communities (a trophic cascade).
- Example: The reintroduction of wolves (apex predator) in Yellowstone National Park controlled elk populations, which allowed willow and aspen trees to recover along riverbanks.
Bottom-Up Control
Population size is primarily regulated by the availability of resources at lower trophic levels, particularly nutrients and primary producers.
- Nutrients, sunlight, and primary producers dictate the carrying capacity of herbivores, which in turn limits carnivores.
- Example: In marine ecosystems, upwelling provides nutrients that cause algal blooms (phytoplankton), which support massive populations of zooplankton, fish, and eventually whales.
C4.1.18 HL Only
Allelopathy and Antibiotic Secretion
Key Understanding (HL) Allelopathy and the secretion of antibiotics are processes used to deter potential competitors by releasing chemical substances.
Organisms frequently engage in forms of biochemical warfare to secure their own survival by reducing interspecific competition for space, light, and nutrients. These chemical secretions can severely inhibit the growth, survival, or reproduction of competing species nearby.
- Allelopathy in Plants: Many plants release specific biochemicals (allelochemicals) into the soil through their roots or fallen leaves. These chemicals inhibit the germination or growth of competing plant species in the vicinity.
Example: The Black Walnut tree ($Juglans$ $nigra$) secretes a toxic compound called juglone, which heavily stunts or kills many nearby plants like tomatoes and apples, ensuring the walnut tree has exclusive access to soil resources.
- Antibiotic Secretion in Microbes: Microorganisms (such as fungi and bacteria) compete intensely for resources in their microenvironments. To gain an advantage, they secrete antibiotics to kill or inhibit competing microbial species.
Example: The $Penicillium$ fungus secretes penicillin, a potent antibiotic that kills sensitive bacteria by interfering with their cell wall synthesis, freeing up nutrients for the fungus.
✅
C4.1 Populations & Communities Complete!
You have successfully reviewed all SL and HL understandings for Biology Theme C4.1.
Check Your Understanding
1. Why is random sampling crucial when estimating a population of daisies in a field?
Random sampling ensures that every area of the field has an equal chance of being selected. This removes human bias (such as selectively choosing areas with more or fewer daisies), ensuring the sample accurately represents the entire population density.
2. A researcher catches 40 mice, marks them, and releases them. A week later, they catch 50 mice, of which 10 are marked. Estimate the population.
Using the Lincoln Index: $N = \frac{n_1 \times n_2}{n_3}$. $N = \frac{40 \times 50}{10} = \frac{2000}{10} = 200$. The estimated population is 200 mice.
3. What is the difference between top-down and bottom-up control in an ecosystem?
Top-down control occurs when an apex predator regulates the population dynamics of the trophic levels below it. Bottom-up control occurs when the availability of primary producers (driven by nutrients) dictates the population sizes of all subsequent higher trophic levels.
4. Explain how allelopathy gives a plant a competitive advantage.
By releasing toxic allelochemicals into the soil, a plant can inhibit the growth of surrounding plant species. This reduces competition for vital resources like water, soil nutrients, and sunlight, giving the allelopathic plant a distinct survival advantage.