Sustainability
Subtopic 1.3 — New Syllabus (First Assessment 2026)
Standard Level + Higher Level
Guiding Question
Content Map
1.3.1 – 1.3.7
Sustainability
1.3.8 – 1.3.13
& SDGs
1.3.14 – 1.3.18
1.3.19 – 1.3.22
| Section | Syllabus Points | Focus |
|---|---|---|
| A | 1.3.1–1.3.7 | Defining sustainability, three pillars, their interconnections |
| B | 1.3.8–1.3.13 | Indicators, ecological footprint, HDI, GPI, Limits to Growth |
| C | 1.3.14–1.3.18 | Development vs. growth, SDGs, MDGs |
| D | 1.3.19–1.3.22 | I=PAT, nested model, circular economy, doughnut economy |
Definition of Sustainability
This is the widely cited Brundtland Definition, from the 1987 report Our Common Future by the World Commission on Environment and Development (WCED).
| Element | Meaning |
|---|---|
| "Meet the needs of the present" | Current populations must have access to resources, food, water, shelter, and opportunities |
| "Without compromising… future generations" | Resource use today must not deplete or degrade the environment so that future people cannot meet their needs |
| "Environmental, social, and economic systems" | Sustainability is not only environmental — it encompasses all three pillars |
The Three Pillars of Sustainability
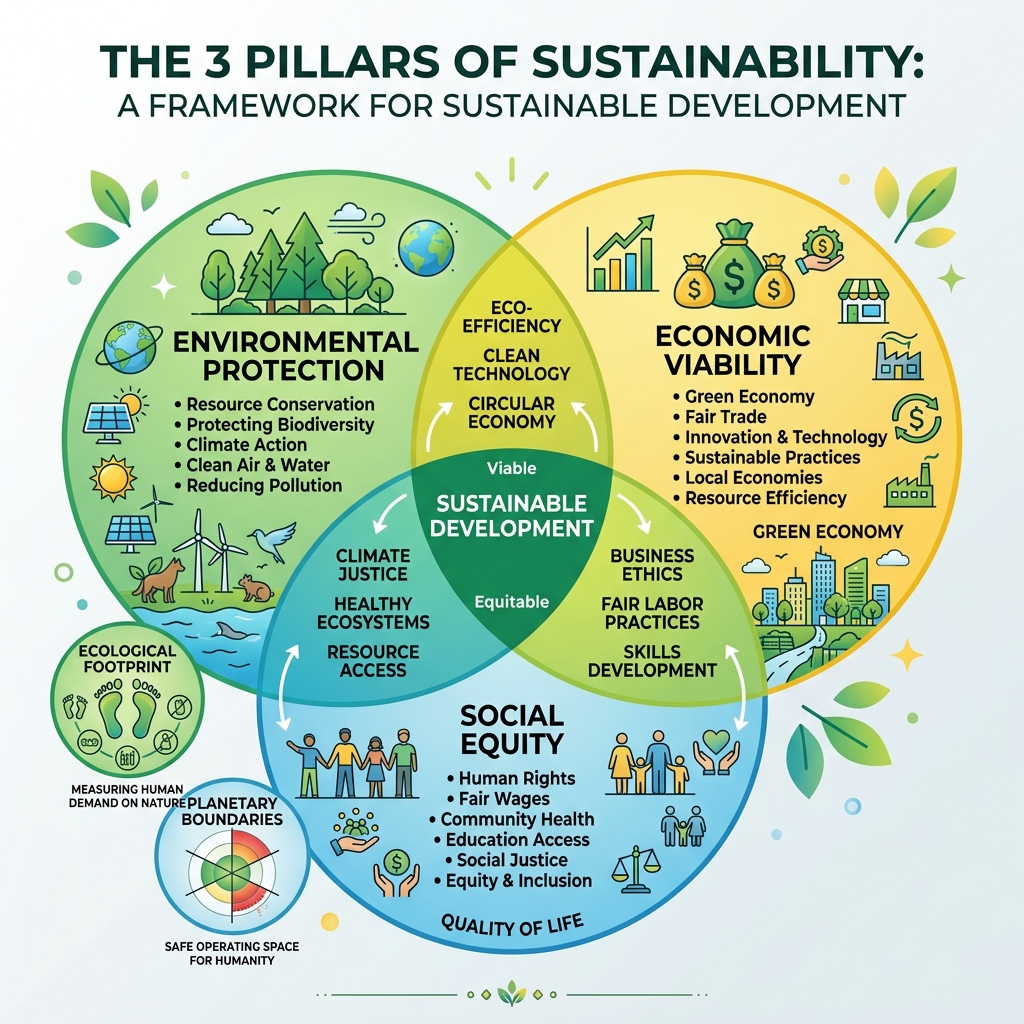
| Pillar | Core Focus | Example Indicator |
|---|---|---|
| 🌍 Environmental | Protection of natural systems, biodiversity, and resources | CO₂ emissions, biodiversity index |
| 👥 Social | Equity, well-being, health, education, and justice | HDI, literacy rate, life expectancy |
| 💰 Economic | Long-term viability of economic systems and livelihoods | GDP per capita, employment rate |
Environmental Sustainability
Key Concepts
| Concept | Definition | Example |
|---|---|---|
| Carrying capacity | The maximum population size an environment can sustain indefinitely given available resources | Island ecosystem supporting a finite number of deer |
| Renewable resources | Resources that replenish on a human timescale | Solar energy, timber (if managed), freshwater |
| Non-renewable resources | Resources that exist in finite quantities and cannot be replaced within a human timescale | Fossil fuels, mineral ores, groundwater in aquifers |
| Ecosystem services | Benefits humans obtain from ecosystems | Pollination, water purification, carbon sequestration, flood control |
Four Categories of Ecosystem Services (MEA Framework)
Food, water, timber
Climate, floods, disease
Recreation, spiritual
Nutrient cycling, soil
Social Sustainability
Key Concepts
| Concept | Definition | Example |
|---|---|---|
| Social capital | The networks, norms, and trust that enable collective action in a community | Community cooperatives, mutual aid networks |
| Cultural diversity | The variety of cultural expressions within a society | Indigenous knowledge systems, language preservation |
| Health | Physical and mental well-being of a population | Access to healthcare, clean water, nutrition |
| Education | Access to quality learning opportunities | Literacy rates, school enrollment, gender parity in education |
| Justice | Fair treatment and equitable distribution of rights and resources | Gender equality, land rights, legal protections |
Economic Sustainability
Key Concepts
| Concept | Definition | Example |
|---|---|---|
| Economic growth | Increase in the production of goods and services (measured by GDP) | Country's GDP rising from $500B to $550B |
| Economic development | Improvement in quality of life, not just output — includes equity, health, education | Better healthcare, infrastructure, reduced poverty |
| Natural capital accounting | Assigning economic value to natural resources and ecosystem services | Valuing a mangrove forest for storm protection + fishery support |
| Circular economy | Economic system aimed at eliminating waste through continual resource use | Recycling electronics, remanufacturing tyres |
Interconnections Between the Pillars
Case Study: Deforestation in the Amazon
Loss of biodiversity,
reduced carbon
sequestration
Displacement of
indigenous communities,
loss of livelihoods
Short-term timber
revenue, but long-term
loss of ecosystem
services
| Scenario | Environmental Effect | Social Effect | Economic Effect |
|---|---|---|---|
| Overfishing | Fish stock collapse, marine ecosystem degradation | Fishing communities lose livelihoods and food source | Fishery industry revenue declines |
| Fast fashion | Textile pollution, water contamination, microplastics | Exploitation of garment workers in developing countries | Low prices for consumers but externalised costs |
| Urbanisation | Habitat loss, urban heat island effect | Improved access to services but potential for slums | Higher productivity and GDP but infrastructure costs |
Triple Bottom Line & Integration
The Triple Bottom Line (TBL), coined by John Elkington (1994), argues that organisations should measure success not just by financial profit, but also by their social and environmental impact.
| TBL Dimension | Equivalent Pillar | Business Metric Example |
|---|---|---|
| 🌿 Planet | Environmental | Carbon footprint, waste reduction, water use |
| 👥 People | Social | Employee welfare, community investment, diversity |
| 💵 Profit | Economic | Revenue, profitability, shareholder return |
Measuring Sustainability — Indicators
| Pillar | Indicator | What It Measures | Strengths / Limitations |
|---|---|---|---|
| 🌍 Environmental | CO₂ emissions (per capita) | Greenhouse gas output per person | Doesn't account for imports/exports of goods |
| Biodiversity index | Species richness and abundance | Difficult to measure consistently across regions | |
| Deforestation rates | Area of forest lost per year | Doesn't distinguish between types of forest or causes | |
| 👥 Social | Human Development Index (HDI) | Life expectancy, education, income combined | Doesn't capture inequality within countries |
| Literacy rate | % of population who can read/write | Binary measure — doesn't reflect quality of education | |
| Life expectancy | Average lifespan at birth | Doesn't capture quality of life or health equity | |
| 💰 Economic | GDP per capita | Average economic output per person | Doesn't account for wealth distribution or environmental costs |
| Gini coefficient | Income inequality (0 = equal, 1 = unequal) | Doesn't capture wealth vs income or non-monetary factors |
Ecological Footprint & Earth Overshoot Day
Ecological Footprint
Measured in global hectares (gha) — the area of biologically productive land needed to regenerate the resources a person/country consumes and absorb their waste.
| Country / Region | Ecological Footprint (gha/person) | Biocapacity (gha/person) | Status |
|---|---|---|---|
| 🇺🇸 United States | ~8.1 | ~3.4 | Overshoot (uses ~2.4× available) |
| 🇨🇳 China | ~3.7 | ~0.9 | Overshoot (uses ~4.1× available) |
| 🇮🇳 India | ~1.2 | ~0.4 | Overshoot (uses ~3.0× available) |
| 🌍 World Average | ~2.7 | ~1.6 | Overshoot — we use ~1.7 Earths |
Earth Overshoot Day
The date each year when humanity has used all the biological resources Earth can regenerate in that year. In 2023, it fell on 2 August.
Earth's annual
resource budget
resets
Earth Overshoot
Day 2023
Budget exhausted
Living on
"ecological debt"
Human Development Index (HDI)
Developed by Pakistani economist Mahbub ul Haq with input from Indian Nobel laureate Amartya Sen. Published annually by the UNDP.
| Dimension | Indicator | Minimum | Maximum |
|---|---|---|---|
| Long and healthy life | Life expectancy at birth | 20 years | 85 years |
| Knowledge | Mean years of schooling + Expected years of schooling | 0 years | 18 years (mean) / 20 years (expected) |
| Decent standard of living | GNI per capita (PPP US$) | $100 | $75,000 |
HDI Categories
| Category | HDI Range | Example Countries |
|---|---|---|
| Very High | 0.800 – 1.000 | Switzerland (0.962), Norway (0.961), Iceland (0.959) |
| High | 0.700 – 0.799 | Russia (0.822), Brazil (0.760), China (0.768) |
| Medium | 0.550 – 0.699 | India (0.633), Kenya (0.575), Bangladesh (0.661) |
| Low | 0.000 – 0.549 | Chad (0.394), Niger (0.394), South Sudan (0.385) |
Genuine Progress Indicator (GPI)
GPI starts with personal consumption expenditure (like GDP) and then adds value for household work, volunteering, and subtracts costs like crime, pollution, and resource depletion.
| Factor | GDP Treatment | GPI Treatment |
|---|---|---|
| Household work / childcare | ❌ Not counted | ✅ Added as positive value |
| Volunteering | ❌ Not counted | ✅ Added as positive value |
| Pollution / environmental damage | ❌ Not subtracted (may even add to GDP via cleanup) | ✅ Subtracted as cost |
| Crime and family breakdown | ❌ Not counted (may add to GDP via legal services) | ✅ Subtracted as cost |
| Resource depletion | ❌ Not subtracted | ✅ Subtracted as cost |
| Income inequality | ❌ Not accounted for | ✅ Adjusted via distributional weighting |
Limits to Growth (Meadows et al., 1972)
Commissioned by the Club of Rome, this was one of the first major attempts to model global sustainability using computer simulations.
Key Model Variables
Output
Production
Resources
Model Predictions (Business-as-Usual Scenario)
| Variable | Behaviour |
|---|---|
| Population | Continues to grow until ~2040, then declines due to resource constraints |
| Food per capita | Peaks around 2020s, then declines sharply |
| Industrial output | Peaks and then falls as resources become scarce |
| Non-renewable resources | Continuously depleted, accelerating collapse |
| Pollution | Continues to rise even after industrial decline |
Quantitative vs. Qualitative Measurement (HL)
| Type | Description | Examples | Strengths | Limitations |
|---|---|---|---|---|
| Quantitative | Numerical data that can be statistically analysed | HDI, CO₂ emissions, ecological footprint, Gini coefficient | Objectively comparable, trend tracking, policy evaluation | May miss cultural/contextual factors, data quality varies |
| Qualitative | Non-numerical assessments based on observation, interviews, case studies | Community well-being surveys, stakeholder interviews, cultural assessments | Captures nuance, local knowledge, cultural dimensions | Subjective, difficult to compare across regions, harder to scale |
Multi-Indicator Approaches
- Dashboard approach: Multiple indicators displayed together (e.g., OECD Better Life Index) — no single summary number
- Composite indices: Combine multiple indicators into one score (e.g., HDI, GII) — easier to compare but loses detail
- Systems thinking: Considers feedback loops and interconnections between indicators
What Is Development?
Development goes far beyond GDP growth. It encompasses improvements in:
| Dimension | Indicators | Examples |
|---|---|---|
| Economic | GDP per capita, employment, infrastructure | Roads, electricity access, industry diversification |
| Social | HDI, literacy, life expectancy, gender equality | Schools, hospitals, social safety nets |
| Environmental | Air quality, water quality, forest cover | Clean energy, waste management, conservation |
Sustainable Development
Growth
Inclusion
Protection
Development
Examples of Sustainable Development in Practice
| Initiative | Economic | Social | Environmental |
|---|---|---|---|
| Costa Rica's payment for ecosystem services | Tourism revenue | Rural employment | Forest regeneration (doubled forest cover since 1980s) |
| Bhutan's GNH policy | Hydropower exports | Cultural preservation, free healthcare & education | Constitution mandates 60% forest cover forever |
| Copenhagen cycling infrastructure | Healthcare savings, tourism | Improved public health, equity in transport | Reduced emissions, less air pollution |
UN Sustainable Development Goals (SDGs)
Adopted by all United Nations Member States in September 2015 as part of the 2030 Agenda for Sustainable Development.
| # | Goal | # | Goal |
|---|---|---|---|
| 1 | 🔴 No Poverty | 10 | 🟡 Reduced Inequalities |
| 2 | 🟡 Zero Hunger | 11 | 🟠 Sustainable Cities & Communities |
| 3 | 🟢 Good Health & Well-being | 12 | 🟤 Responsible Consumption & Production |
| 4 | 🔴 Quality Education | 13 | 🟢 Climate Action |
| 5 | 🔴 Gender Equality | 14 | 🔵 Life Below Water |
| 6 | 🔵 Clean Water & Sanitation | 15 | 🟢 Life on Land |
| 7 | 🟡 Affordable & Clean Energy | 16 | 🔵 Peace, Justice & Strong Institutions |
| 8 | 🔴 Decent Work & Economic Growth | 17 | 🔵 Partnerships for the Goals |
| 9. Industry, Innovation & Infrastructure | |||
SDG Interconnections
Example: How Clean Energy (SDG 7) Connects to Other Goals
Clean Energy
Climate Action
Industry & Innovation
Economic Growth
| Primary Action | SDG | Positive Spillovers | Potential Tensions |
|---|---|---|---|
| Expanding solar energy | SDG 7 | SDG 13 (less emissions), SDG 3 (less air pollution), SDG 8 (new jobs), SDG 9 (innovation) | SDG 15 (land use for solar farms may affect ecosystems), SDG 12 (mining for materials) |
| Improving sanitation | SDG 6 | SDG 3 (fewer waterborne diseases), SDG 5 (women's safety), SDG 4 (girls attend school) | SDG 9 (cost of infrastructure), SDG 17 (needs international funding) |
| Reducing hunger | SDG 2 | SDG 1 (less poverty), SDG 3 (better nutrition), SDG 4 (children can learn) | SDG 15 (agricultural expansion may cause deforestation), SDG 14 (overfishing) |
Millennium Development Goals (MDGs) vs. SDGs
| Feature | MDGs (2000–2015) | SDGs (2015–2030) |
|---|---|---|
| Number of goals | 8 | 17 |
| Scope | Mainly developing countries | Universal — all countries |
| Pillars covered | Mainly social and some economic | Environmental, social, and economic — all three pillars |
| Stakeholders | Primarily governments | Multi-stakeholder: governments, businesses, civil society, individuals |
| Environmental focus | Limited (only MDG 7: Environmental Sustainability) | Strong (SDGs 6, 7, 11, 12, 13, 14, 15) |
| Participation | Top-down from UN | Extensive global consultation process |
MDG Successes and Failures
- Success: Halved the proportion of people living in extreme poverty (MDG 1)
- Success: Enrolment in primary education in developing countries increased from 83% to 91%
- Failure: Goal to halve the proportion of people without safe drinking water was narrowly missed
- Failure: Environmental sustainability (MDG 7) was largely not achieved
The I = PAT Equation
| Variable | Meaning | Unit/Measure | Effect on Impact |
|---|---|---|---|
| I — Impact | Environmental impact (e.g., pollution, resource use, CO₂) | Varies (e.g., tonnes CO₂) | Dependent variable |
| P — Population | Number of people | Number of individuals | ↑ more people = ↑ more impact |
| A — Affluence | Consumption per person | GDP per capita or resource use per capita | ↑ more wealth/consumption = ↑ more impact |
| T — Technology | Impact per unit of consumption | Environmental impact per unit of GDP | ↑ more efficient tech = ↓ impact; ↑ polluting tech = ↑ impact |
Example Calculations
P = 100M
A = $5,000/capita
T = 0.5 kg CO₂/$
= 250 million kg CO₂
P = 10M
A = $50,000/capita
T = 0.05 kg CO₂/$
= 25 million kg CO₂
The Ecological / Nested Model of Sustainability
Three Nested Ellipses Model
This model shows that the economy is a subset of society, which is a subset of the environment. The environment is the largest and most fundamental system.
🌍 ENVIRONMENTAL SYSTEM
👥 SOCIAL SYSTEM
💰 ECONOMIC
SYSTEM
| System | Contains | Dependency |
|---|---|---|
| 🌍 Environment (outermost) | All natural resources, ecosystems, atmosphere | Self-sustaining (but vulnerable to damage) |
| 👥 Society (middle) | Cultures, institutions, communities, governance | Depends entirely on the environment for resources and life support |
| 💰 Economy (innermost) | Markets, trade, industry, financial systems | Depends on society for rules, labour, demand — and on the environment for raw materials and energy |
Circular Economy
Linear vs. Circular Economy
Take → Make → Use → Dispose
in Use
Natural Systems
Three Principles of the Circular Economy
| Principle | Description | Examples |
|---|---|---|
| 1. Design out waste and pollution | Products designed from the start to minimise waste | Biodegradable packaging, modular electronics for easy repair |
| 2. Keep products and materials in use | Extend product lifespan through repair, reuse, remanufacturing | Refurbished phones, clothing rental, car-sharing |
| 3. Regenerate natural systems | Return biological nutrients to the earth; enhance rather than degrade ecosystems | Composting, reforestation, regenerative agriculture |
Real-World Examples
| Example | Sector | Circular Strategy |
|---|---|---|
| Patagonia | Clothing | Worn Wear programme — repair, reuse, resale of clothing |
| Fairphone | Electronics | Modular smartphone — replaceable parts, extended lifespan |
| Interface | Flooring | Carpet tiles designed for recycling; "Mission Zero" to eliminate waste |
| Kamikatsu, Japan | Waste management | Town with 45-category recycling system; near-zero waste |
Critical Evaluation of Sustainability Models (HL)
| Model | Description | Strengths | Limitations |
|---|---|---|---|
| Brundtland Definition (1987) |
"Meeting present needs without compromising future generations" | Widely accepted; intergenerational equity; holistic | Vague — "needs" and "future generations" not clearly defined; hard to operationalise |
| Three Pillars / Triple Bottom Line | Three overlapping circles: environmental, social, economic | Simple, intuitive; encourages balance; widely adopted in policy and business | Implies the three are equal — in reality, environment underpins the other two; can be used for "greenwashing" |
| Nested Model / Ecological Model | Economy within society within environment (concentric circles) | Correctly shows dependency — economy cannot exist without society and environment; emphasizes biophysical limits | May oversimplify the bidirectional influence between systems; less intuitive for business applications |
| Doughnut Economy (Kate Raworth, 2017) |
A "safe and just space for humanity" between a social foundation (inner ring) and ecological ceiling (outer ring) | Balances social minimums with environmental maximums; visual and actionable; incorporates justice | Complex to measure all indicators simultaneously; doesn't fully address governance or geopolitical tensions |
The Doughnut Economy Model — Visual
SAFE & JUST
SPACE FOR
HUMANITY
Outer ring (red): Ecological ceiling — planetary boundaries (e.g., climate change, biodiversity loss, ocean acidification)
Inner space (green): Social foundation — human needs (e.g., food, water, health, education, political voice)
Key Planetary Boundaries (Outer Ring of Doughnut)
| Boundary | Status | Safe Limit |
|---|---|---|
| Climate change | Exceeded | 350 ppm CO₂ (currently ~420 ppm) |
| Biosphere integrity (biodiversity loss) | Exceeded | <10 E/MSY |
| Nitrogen/phosphorus cycles | Exceeded | Industrial N fixation < 62 Tg N/yr |
| Ocean acidification | Near limit | ≥ 80% of pre-industrial Ω aragonite |
| Freshwater use | Within bounds | < 4,000 km³/yr |
| Land-system change | Exceeded | < 75% forested land remaining |
Key Terms
| Term | Definition |
|---|---|
| Sustainability | Maintaining the capacity of environmental, social, and economic systems to meet present needs without compromising future generations |
| Three Pillars | The environmental, social, and economic dimensions that together constitute sustainability |
| Natural Capital | The world's stocks of natural assets — geology, soil, air, water, and all living things — from which humans derive ecosystem services |
| Ecosystem Services | The benefits humans obtain from ecosystems: provisioning, regulating, cultural, and supporting services |
| Ecological Footprint | The area of biologically productive land and water required to produce resources consumed and absorb waste generated by a population |
| Earth Overshoot Day | The date each year when humanity's demand for ecological resources exceeds what Earth can regenerate in that year |
| HDI | Human Development Index — a composite measure of life expectancy, education, and income |
| GPI | Genuine Progress Indicator — adjusts personal consumption for environmental and social costs/benefits |
| SDGs | Sustainable Development Goals — 17 UN goals (2015–2030) for global sustainable development |
| MDGs | Millennium Development Goals — 8 UN goals (2000–2015) focused on reducing poverty in developing countries |
| I = PAT | Impact = Population × Affluence × Technology — equation showing drivers of environmental impact |
| Circular Economy | An economic system aimed at eliminating waste through continual use of resources (design out waste, keep in use, regenerate) |
| Triple Bottom Line | Framework measuring organisational success by People, Planet, and Profit (TBL) |
| Sustainable Development | Development that meets present needs without compromising the ability of future generations to meet their own needs |
| Doughnut Economy | Model by Kate Raworth defining a "safe and just space" between social foundation and ecological ceiling |
Exam Strategy & Command Terms
Command Terms for Subtopic 1.3
| Command Term | What to Do | Example Question |
|---|---|---|
| Evaluate | Make a judgement supported by reasoning and evidence; discuss strengths and limitations | "Evaluate the effectiveness of the SDGs in achieving sustainable development." |
| Discuss | Present a balanced argument with multiple perspectives | "Discuss the extent to which economic growth is compatible with sustainability." |
| Explain | Give a detailed account with reasoning; show how/why something occurs | "Explain how the I=PAT equation can be used to analyse environmental impact." |
| Compare | Identify similarities and differences between two or more items | "Compare the three pillars model with the nested model of sustainability." |
Common Question Patterns
"Using a case study, explain how the three pillars of sustainability are interconnected."
Strategy: Choose a clear case study (e.g., fast fashion, palm oil, mining). Discuss environmental, social, AND economic impacts. Show interconnections.
"Analyse how progress towards one SDG can support or hinder progress towards others."
Strategy: Choose 2–3 specific SDGs. Show positive spillovers AND potential trade-offs. Use data or examples.
"Using the data provided, calculate the ecological deficit/surplus for Country X and suggest one way to reduce it."
Strategy: Ecological Footprint − Biocapacity = Deficit (if negative) or Surplus (if positive). Always interpret the result and suggest a realistic solution.
"Explain how changes in population, affluence, or technology can affect environmental impact, using the I=PAT equation."
Strategy: Define each variable. Give a numerical example showing how changing one variable changes I. Discuss that T can both increase and decrease impact.
"Compare the three pillars model with the nested model. Which model better represents the relationship between the environment, society, and the economy? Justify your answer."
Strategy: Describe both models. Note that three pillars implies equality while nested shows dependency. Argue for one (usually nested is stronger environmentally) and justify with reasoning.
General Exam Advice
- Always use specific examples — countries, organisations, data, or case studies
- Address all three pillars — don't focus only on environmental aspects
- Use key terminology correctly — ecological footprint, carrying capacity, HDI, I=PAT, etc.
- For evaluation questions: always present both sides before making a judgement
- For HL questions: go beyond description to critical analysis — discuss strengths AND limitations
- Manage your time — don't spend too long on one question; allocate time based on marks