Energy & Biomass
in Ecosystems
Subtopic 2.2 — New Syllabus (First Assessment 2026)
Standard Level + Higher Level
What You Need to Know
This subtopic examines how energy flows and matter cycles through ecosystems, why energy transfer is inefficient, and how human activities disrupt these natural processes.
Guiding Questions
- How can flows of energy and matter through ecosystems be modelled?
- How do human actions affect the flow of energy and matter, and what is the impact on ecosystems?
- What strategies can be employed to mitigate human impacts on the natural cycles of energy and matter?
Content Map
Laws of thermodynamics, photosynthesis, respiration
Food chains, webs, pyramids, productivity
Bioaccumulation, pollution, human activities
Ecosystems Are Sustained by Energy & Matter
Energy
(Autotrophs)
(Herbivores → Carnivores)
& Detritivores
Energy Flow
Enters as sunlight → converted to chemical energy by producers → passed through consumers → exits as heat. Energy is not recycled — a constant supply from the sun is required.
Matter Cycling
Elements (C, N, P, etc.) cycle through biotic and abiotic components via biogeochemical cycles. Decomposers break down dead organic matter, returning nutrients to the soil/atmosphere for reuse.
The First Law of Thermodynamics
Application to Ecosystems
- Solar energy is captured by producers and converted to chemical energy (glucose/biomass)
- Chemical energy is transferred between trophic levels as organisms eat each other
- At each transfer, some energy becomes heat — it is still "there" (conserved) but no longer usable by organisms
- Energy that enters as sunlight eventually exits as heat — it does not cycle
Photosynthesis & Cellular Respiration
🌿 Photosynthesis
Location: Chloroplasts (in chlorophyll)
Input: CO₂, water, sunlight
Output: Glucose + Oxygen
Transformation: Light energy → chemical energy
🔬 Cellular Respiration
Location: Mitochondria
Input: Glucose + Oxygen
Output: CO₂ + Water + ATP
Transformation: Chemical energy → usable energy + heat
Photosynthesis: Light Energy → Biomass
What Happens to the Glucose?
- Immediate use: Glucose is broken down via respiration for the plant's own metabolic needs
- Storage: Converted to starch for later energy use
- Biomass formation: Converted to cellulose, proteins, lipids → structural components of the plant
Producers: The First Trophic Level
Types of Producers
| Type | Habitat | Examples |
|---|---|---|
| Terrestrial plants | Land ecosystems | Grasses, trees, shrubs, mosses |
| Algae | Freshwater & marine | Diatoms, kelp, seaweed |
| Photosynthetic bacteria | Various (incl. extreme environments) | Cyanobacteria, purple sulfur bacteria |
Why Producers Are Essential
- Energy gateway: Only entry point for solar energy into ecosystems
- Oxygen production: Release O₂ needed for respiration by most organisms
- Carbon fixation: Remove CO₂ from atmosphere, regulating climate
- Habitat: Physical structure for many species (e.g., trees in forests)
- Hydrological cycle: Transpiration contributes to atmospheric moisture
Cellular Respiration: Releasing Energy
What is ATP?
ATP is the "energy currency" of cells. It powers:
• Cell division — growth & repair
• Active transport — moving molecules across membranes
• Nerve impulses — signal transmission
• Reproduction — gamete production
Energy Transformed to Heat
Heat released during respiration cannot be converted back into chemical energy by living things — it is lost from the biological system forever.
The Second Law of Thermodynamics
Consumers: Diverse Energy Strategies
| Strategy | Description | Examples |
|---|---|---|
| Herbivory | Feed on living plants/algae | Deer, rabbits, caterpillars, zooplankton |
| Predation | Hunt and kill other animals | Lions, eagles, spiders, sharks |
| Parasitism | Live on/in host, extract nutrients | Tapeworms, fleas, mistletoe |
| Detritivory | Feed on dead organic matter (detritus) | Earthworms, millipedes, woodlice |
| Saprotrophy | Secrete enzymes onto dead matter, absorb nutrients | Fungi, decomposer bacteria |
| Scavenging | Feed on already-dead animals | Vultures, hyenas, crabs |
Food Chains: Producers to Consumers
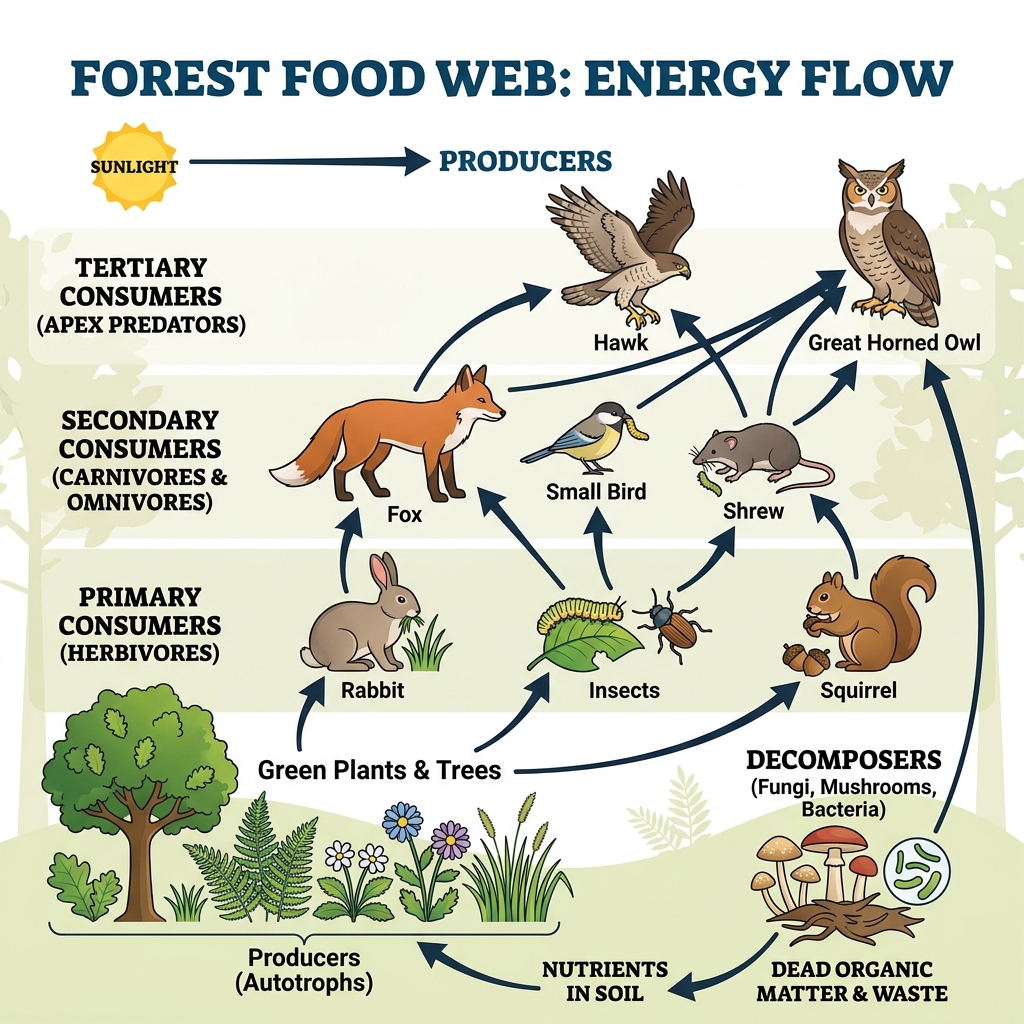
Reading Food Chains
- Arrows show the direction of energy flow (not "who eats whom" — though that's implied)
- The arrow points from the food → to the eater
- Each organism feeds at a specific trophic level
Trophic Levels
- Level 1: Producers (grass)
- Level 2: Primary consumers (herbivore)
- Level 3: Secondary consumer (carnivore)
- Level 4: Tertiary consumer (top carnivore)
Carbon Compounds & Trophic Levels
What Moves Between Trophic Levels?
It's not just "energy" in the abstract — it is carbon compounds (organic molecules like glucose, proteins, fats) that carry both matter AND energy. When a rabbit eats grass, it gains carbon-based molecules that the grass built from CO₂.
Role of Decomposers
- Not shown in simple linear food chains, but present in all ecosystems
- Gain carbon compounds from dead organisms at all trophic levels
- Recycle matter back to the abiotic environment → available for producers
- Form the base of detrital food webs (parallel to grazing food webs)
Energy Losses Along Food Chains
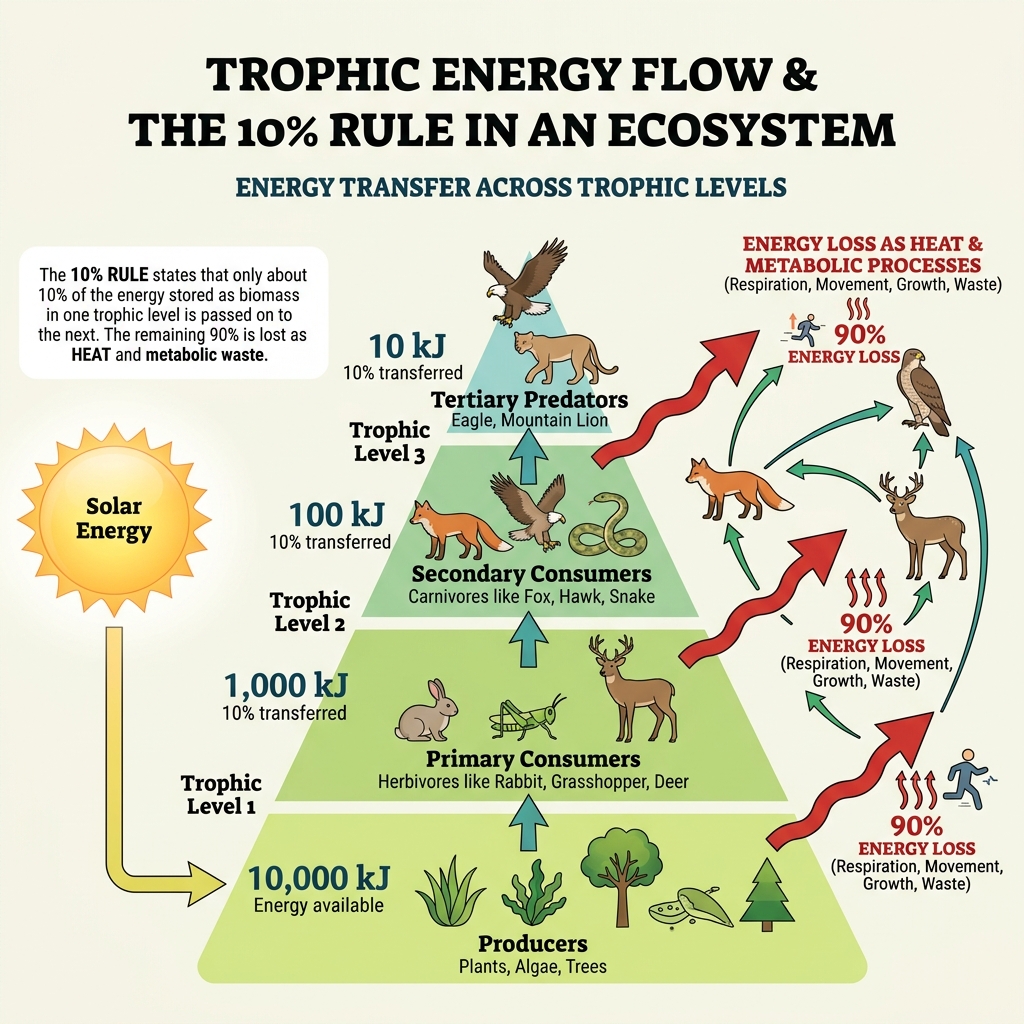
Where Does Energy Go?
| Stage of Loss | Mechanism |
|---|---|
| 1. Not eaten | Some organisms/parts are never consumed (thorns, bones, roots) |
| 2. Not digested | Indigestible material passes through as faeces (cellulose, shells) |
| 3. Not assimilated | Some absorbed energy used immediately for metabolism, not stored as biomass |
| 4. Respiration heat loss | Cellular respiration converts energy to ATP + heat; heat is lost permanently |
Gross Productivity & Net Productivity
Gross Productivity (GP)
- Total biomass produced by an organism/trophic level over a given time
- For producers: total photosynthesis (all glucose made)
- For consumers: total energy from all food eaten
Net Productivity (NP)
- Biomass remaining after the organism uses some for respiration
- Available for growth, reproduction, and consumption by the next level
- This is what's available to herbivores/carnivores
Worked Example
A plant captures 100 units of energy via photosynthesis (GP = 100). It uses 40 units for respiration (R = 40).
NP = 100 − 40 = 60 units → available for growth and for herbivores to consume.
Limited Trophic Levels
Why Food Chains Are Short
With ~10% transfer efficiency, energy diminishes rapidly:
Level 2: 10,000 kJ
Level 3: 1,000 kJ
Level 4: 100 kJ
Level 5: 10 kJ ← barely enough
Level 6: 1 kJ ← cannot sustain a population
Food Webs: Real-World Complexity
Food Chains vs Food Webs
- Chain: Linear, simple, one path (grass → rabbit → fox)
- Web: Interconnected, realistic, many overlapping paths
- Web shows that most organisms feed at multiple trophic levels (omnivores)
Why Food Webs Matter
- Stability: More connections = more alternative pathways = more resilience
- Impact prediction: Removal of one species has cascading effects through the web
- Biodiversity indicator: Complex webs = healthy, diverse ecosystems
Measuring Biomass
Method: Collection & Drying
- Collect representative samples of organisms from the ecosystem
- Dry samples in an oven at constant temperature until stable weight is reached
- Weigh the dry mass (removes all water content)
- Extrapolate from sample to estimate total biomass of the trophic level
Measuring Energy Content: Calorimetry
- Burn dried sample in a calorimeter
- Heat released warms a known mass of water
- Measure temperature change → calculate energy content
- Extrapolate to estimate total energy in the trophic level's biomass
Ecological Pyramids
Pyramid of Numbers
Can be inverted (e.g., one tree → many insects)
Pyramid of Biomass
Usually upright; can be temporarily inverted in aquatic systems
Pyramid of Energy
Always upright — the most reliable pyramid type
Bioaccumulation & Biomagnification
Bioaccumulation
Pollutant concentration increases within an individual organism over time because the organism absorbs it faster than it can excrete or metabolize it.
Biomagnification
Pollutant concentration increases at each trophic level because predators consume many contaminated prey, concentrating the pollutant.
Classic Example: DDT
Water (0.000003 ppm) → Plankton (0.04 ppm) → Small fish (0.5 ppm) → Large fish (2 ppm) → Eagle (25 ppm)
DDT caused eggshell thinning in raptors (eagles, pelicans), leading to reproductive failure. This was famously documented by Rachel Carson in Silent Spring (1962).
Microplastics & Pollutant Transmission
How Microplastics Amplify Pollutant Transfer
- Microplastics (plastic particles <5mm) absorb and concentrate hydrophobic pollutants like PCBs, DDT, and heavy metals from surrounding water
- Organisms mistake microplastics for food (zooplankton, filter feeders, fish)
- Pollutants desorb from the plastic inside the organism's gut → absorbed into tissues
- Microplastics act as "Trojan horses" — carrying concentrated pollutants into the food chain
- Because microplastics are virtually indestructible, they persist and transmit pollutants through multiple trophic levels
Human Activities & Energy/Matter Flows
| Activity | Impact on Energy Flow | Impact on Matter Transfer |
|---|---|---|
| Burning fossil fuels | Releases stored solar energy (from ancient producers) as heat | Releases ancient carbon → increased atmospheric CO₂ |
| Deforestation | Reduces photosynthetic capacity → less energy captured | Reduces carbon fixation; releases stored carbon when burned/decays |
| Urbanization | Creates impervious surfaces → alters local energy budgets | Seals soil → disrupts nutrient cycling and decomposition |
| Agriculture | Simplifies food chains → reduces energy flow pathways | Fertilizer inputs disrupt N and P cycles; monocultures reduce matter cycling |
Autotrophs vs Heterotrophs
Autotrophs ("self-feeders")
- Produce own organic compounds from CO₂ + H₂O
- Use light energy (photoautotrophs) or chemical energy (chemoautotrophs)
- Examples: Plants, algae, cyanobacteria
- Form the base of all food chains
Heterotrophs ("other-feeders")
- Cannot fix carbon from CO₂ — must consume other organisms
- Include all consumers and decomposers
- Examples: Animals, fungi, most bacteria
- Obtain carbon compounds by eating, absorbing, or parasitizing
Photoautotrophs vs Chemoautotrophs
Photoautotrophs
- Drive carbon fixation using solar energy (photosynthesis)
- Contain pigments like chlorophyll to capture light
- Examples: Terrestrial plants, green algae, kelp
- Dominant producers in sunlit environments
Chemoautotrophs
- Fix carbon using energy from oxidation of inorganic molecules
- Synthesize organic matter without any solar radiation
- Examples: Deep-sea vent bacteria, nitrifying bacteria
- Foundation of deep ocean floor and cave ecosystems
Primary ProductivityHL
Gross Primary Productivity (GPP)
The total rate of biomass production by producers through photosynthesis. This includes all glucose made — before any is used for respiration.
Net Primary Productivity (NPP)
The rate of biomass production remaining after producers' own respiration. This is what's available to consumers.
Secondary ProductivityHL
Assimilation Efficiency
Not all food eaten is assimilated. Secondary productivity depends on:
- Ingestion: Total food consumed
- Assimilation: What is absorbed (minus faeces)
- Respiration: Energy used for metabolism (minus heat loss)
- NP (consumer) = Assimilated food − Respiration
Example
A bird eats 100g of seeds. It assimilates 80g (20g lost as faeces). It uses 60g for respiration. Secondary NP = 80 − 60 = 20g of new biomass (available for growth, reproduction, and predators).
NPP: The Basis for Food ChainsHL
Why NPP and Not GPP?
- GPP includes glucose that the plant uses for its own respiration — that energy is not available to herbivores
- NPP = what's left over after the plant's metabolic needs → this is the biomass available for consumption
- If herbivores consumed more than NPP, they would be depleting the producer's biomass, reducing future productivity
Maximum Sustainable YieldsHL
MSY Applied to Fisheries
MSY = the highest catch that can be taken indefinitely without causing population decline. Exceeding MSY leads to fishery collapse.
Eating fish (Level 3)
Low NPP available
Small sustainable yield
Eating plants (Level 1)
High NPP available
Large sustainable yield
Ecological EfficiencyHL
Worked Example
Producers receive 20,000 kJ of solar energy and convert it to 2,500 kJ of biomass.
Primary consumers receive 2,500 kJ of this as food.
Typical range: 1–20% depending on ecosystem and species. The "10% rule" is an average approximation.
Entropy & Biomass FlowHL
Entropy in Ecosystems
- Entropy is a measure of disorder or randomness in a system
- When sunlight (ordered electromagnetic radiation) is converted to chemical energy (glucose) and then to heat (disordered molecular motion), entropy increases
- Each trophic transfer further increases entropy — energy becomes less concentrated, less organized, less useful
- The total entropy of the universe always increases — this is the essence of the second law
The Big Picture
Ecosystems are dissipative structures — they maintain internal order (low entropy) by continuously importing low-entropy energy (sunlight) and exporting high-entropy energy (heat). When the energy input stops, the system collapses.
Essential Vocabulary
| Term | Definition |
|---|---|
| Autotroph | Organism that synthesizes its own carbon compounds from inorganic sources (CO₂) |
| Heterotroph | Organism that obtains carbon compounds from other organisms |
| Biomass | Stored organic matter (dry mass) in living or recently living organisms |
| Trophic level | A feeding position/stage in a food chain |
| Food chain | Linear sequence of organisms through which energy and matter transfer |
| Food web | Network of interconnected food chains in a community |
| Gross productivity (GP) | Total biomass produced per unit time (before respiration losses) |
| Net productivity (NP) | Biomass remaining after respiration: NP = GP − R |
| Ecological efficiency | % of energy at one trophic level passed to the next |
| Bioaccumulation | Buildup of pollutant in an individual organism over time |
| Biomagnification | Increasing pollutant concentration at successive trophic levels |
| Microplastics | Plastic particles <5mm that absorb and transport pollutants |
| Maximum sustainable yield | Maximum harvestable biomass without depleting the resource |
| Entropy | Measure of disorder; increases with each energy transfer |
Key Takeaways & Exam Tips
Must-Know Calculations
NP = GP − R
Calculate net productivity from gross and respiration values
Efficiency = (next level ÷ current level) × 100%
Calculate ecological efficiency between trophic levels
Common Exam Patterns
- Construct food chains/webs from data → label trophic levels, identify producers/consumers
- Calculate energy transfer between levels → apply the ~10% rule with real data
- Bioaccumulation chains → show increasing concentration at each level
- Explain energy losses → use second law of thermodynamics, heat loss, respiration
- Compare GP vs NP → know the formula and what each represents
- Human impact analysis → identify which flows (energy/matter) are disrupted and how
You've covered all 29 syllabus points ✅
2.2.1 – 2.2.21 (SL) + 2.2.23 – 2.2.29 (HL)