Climate & Biomes
Subtopic 2.4 — New Syllabus (First Assessment 2026)
Standard Level + Higher Level
What You Need to Know
This subtopic examines how climate determines the distribution of biomes, how atmospheric and oceanic systems shape regional climates, and how climate change and human activities alter biome distribution worldwide.
Guiding Questions
- How does climate determine the distribution of natural systems?
- How are changes in Earth systems affecting the distribution of biomes?
- What role do human activities play in altering the distribution and characteristics of biomes?
- How do ocean currents and atmospheric circulation patterns influence regional climates and biomes?
Weather vs climate, biome definition, abiotic determinants, biome categories
Tricellular model, ocean currents, planetary heat distribution
Climate-driven biome shifts, human interventions, ENSO, tropical cyclones
Climate vs Weather
| Feature | Weather | Climate |
|---|---|---|
| Timescale | Minutes to days | 30+ years (long-term average) |
| Scope | Local, specific place & time | Regional or global patterns |
| Variables | Temperature, rain, wind, humidity, pressure — at a moment | Average temperature, precipitation patterns, seasonal trends |
| Changes | Rapid, unpredictable | Gradual, studied over decades |
| Example | "It rained in London today" | "London has a temperate maritime climate with mild winters" |
What Is a Biome?
Biomes are determined by three key climate factors:
How Each Factor Shapes Biomes
- Insolation: Solar radiation drives photosynthesis — high insolation near the equator supports dense, biodiverse forests; low insolation at poles limits vegetation growth.
- Temperature: Affects metabolic rates, growing season length, and which organisms survive. Tropical biomes: consistently warm year-round. Polar biomes: extremely cold with short growing seasons.
- Precipitation: Determines soil moisture and water availability. Deserts (<250 mm/yr) have sparse vegetation; tropical rainforests (>2500 mm/yr) support lush growth.
Abiotic Factors & Biome Distribution
| Abiotic Factor | Effect on Biome Distribution |
|---|---|
| Temperature | Controls metabolic rates & growing season length. Biomes classified along a gradient from cold polar to warm tropical. |
| Rainfall | Determines soil moisture & vegetation type. Biomes classified from arid deserts to wet rainforests. |
| Latitude | Controls solar energy received → temperature & daylight. Tropical (0°–23.5°) → Temperate (23.5°–66.5°) → Polar (66.5°–90°). |
| Elevation | Temperature drops ~6.5 °C per 1000 m. Altitude mimics latitude — mountaintops can support tundra-like biomes near the equator. |
Climate Graphs (Climatographs)
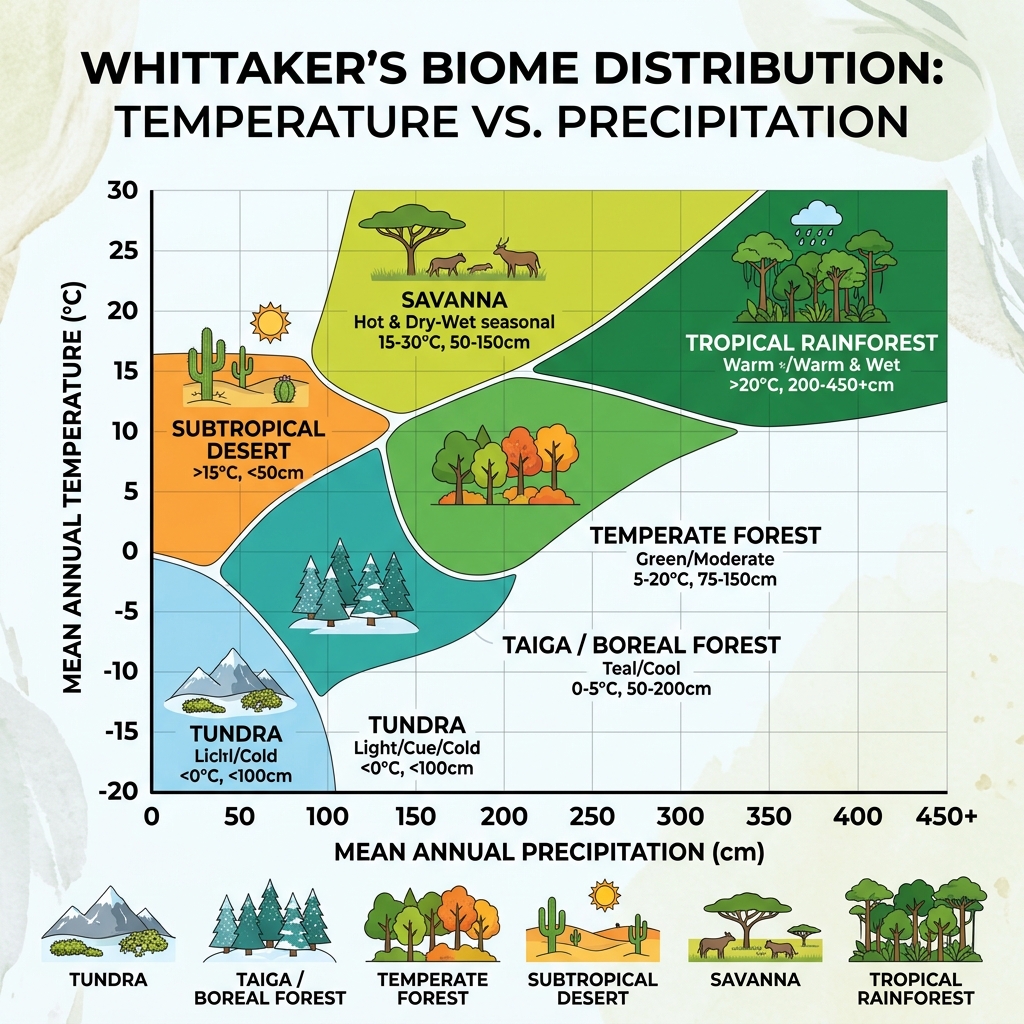
Climate graphs plot monthly temperature (line) and precipitation (bars) for a location. They are used to identify and classify the biome at a given site.
Whittaker's Biome Classification Diagram — Robert Whittaker plotted mean annual temperature vs rainfall for sites worldwide and grouped biomes accordingly. If you know the average temperature and precipitation, you can predict the biome.
Major Biome Groups
Comparing Four Contrasting Terrestrial Biomes
| Biome | Temperature | Rainfall | NPP | Biodiversity | Limiting Factor |
|---|---|---|---|---|---|
| Tropical Rainforest | ~26 °C year-round | >2500 mm/yr | Very high | Very high | Light competition (canopy) |
| Desert | 45–49 °C day / cold night | <250 mm/yr | Very low | Low | Water availability |
| Tundra | −30 to 10 °C | 150–250 mm/yr | Very low | Low | Temperature, permafrost, short growing season |
| Temperate Forest | Seasonal (hot summer / cold winter) | 500–1500 mm/yr | Moderate | Moderate | Seasonal temperature variation |
The Tricellular Model of Atmospheric Circulation
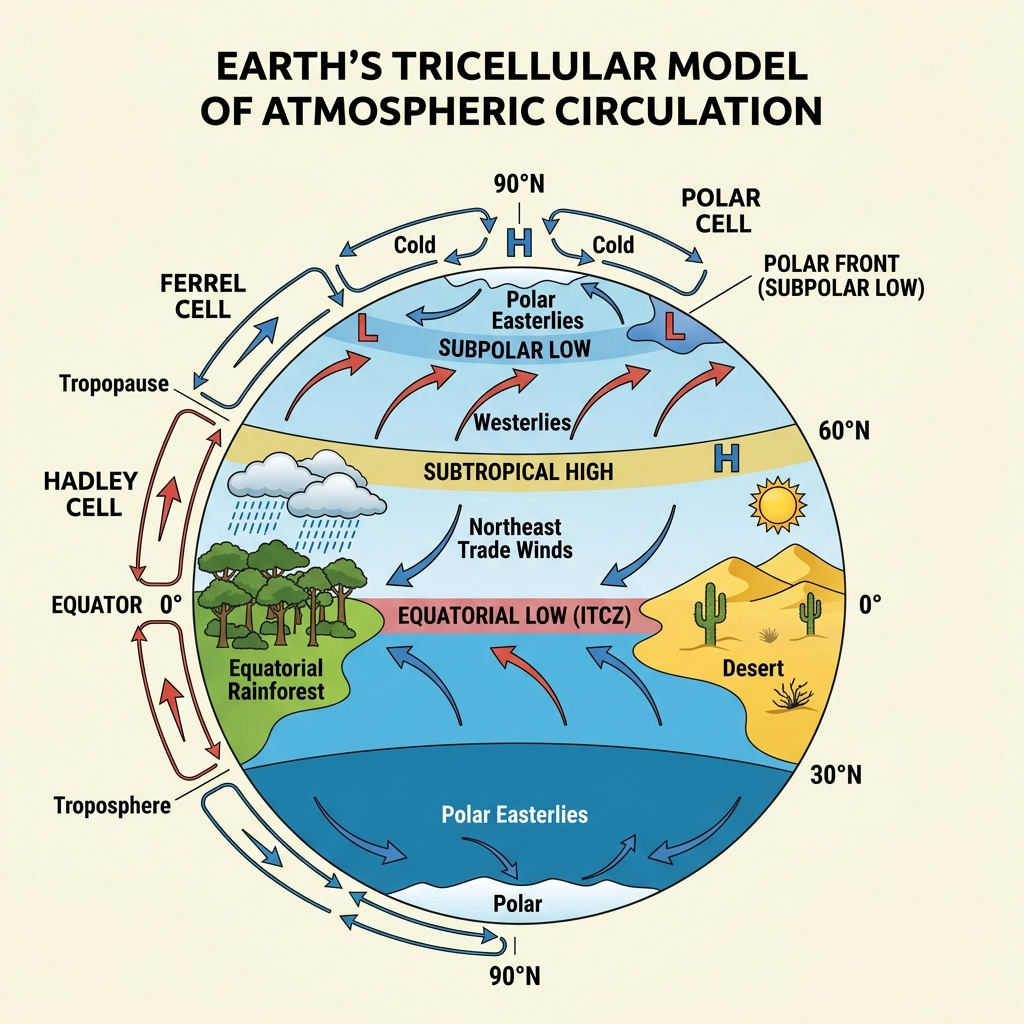
Three circulation cells redistribute heat from the equator toward the poles:
| Cell | Latitude | Mechanism | Effect on Climate |
|---|---|---|---|
| Hadley Cell | 0° – 30° | Warm air rises at equator (low pressure) → flows poleward at altitude → cools, descends at ~30° (high pressure) | Equatorial rainfall (ITCZ); dry subtropical deserts at 30° |
| Ferrel Cell | 30° – 60° | Mid-latitude westerlies; indirect circulation driven by Hadley & Polar cells | Moderate temperatures; prevailing westerlies bring rain to west coasts |
| Polar Cell | 60° – 90° | Cold, dense air descends at poles → flows equatorward → rises at ~60° | Cold, dry polar deserts; precipitation near subpolar low |
The ITCZ (Intertropical Convergence Zone)
The meeting point of the NE and SE trade winds near the equator. Air is heated, becomes less dense, and rises by convection → forms massive cumulonimbus clouds → heavy, reliable rainfall. The ITCZ is the engine of tropical rainforest biomes.
Ocean Currents & Heat Distribution
Absorption: Oceans absorb ~90% of solar radiation reaching Earth's surface. Water has a high heat capacity → stores large amounts of heat. Oceans cover ~71% of Earth's surface.
Types of Currents
| Type | Driver | Depth | Role |
|---|---|---|---|
| Surface currents | Wind | Top ~400 m | Move warm equatorial water toward poles |
| Deep currents | Density differences (thermohaline) | Abyssal depths | Return cold water toward equator; complete the "Global Conveyor Belt" |
Thermohaline Circulation (Global Conveyor Belt)
Key Currents & Biome Influence
- Gulf Stream: Carries warm water from Gulf of Mexico → NW Europe. Keeps UK & Scandinavia 5–10 °C warmer than equivalent latitudes → supports temperate forests instead of tundra.
- California Current: Cold current along western North America → cooler coastal climate → supports coastal scrub and fog-dependent ecosystems.
- Peru (Humboldt) Current: Cold upwelling current → nutrient-rich waters → supports massive marine productivity (anchovy fishery).
Global Warming & Biome Shifts
Climate change threatens species and ecosystems because the distribution of species and biomes is largely determined by climate. As conditions shift, organisms must move, adapt, or perish.
How Biomes Shift
Documented Examples
- Sahel region (Africa): Woodlands converting to savanna due to reduced rainfall and rising temperatures.
- Boreal forest: Models project midwestern prairie climate migrating into current boreal zones — boreal forest shifts northward into tundra.
- Arctic tundra: Shrubs and trees advancing northward as permafrost thaws; tundra biome shrinking.
- Mountains: Alpine biomes compress upward as lower-elevation temperatures warm — "summit trap" for cold-adapted species.
Impacts of Biome Shifts
| Impact | Explanation |
|---|---|
| Biodiversity loss | Species unable to migrate fast enough face extinction |
| Reduced NPP | Drought stress decreases terrestrial primary productivity |
| Carbon feedback | Less NPP = less CO₂ absorption → accelerates warming |
| Food web disruption | Asynchrony between species at different trophic levels |
Three General Climate PatternsHL
The Köppen climate classification (developed 1884, still widely used) divides climates into five groups (A–E) based on rainfall and temperature. Three overarching patterns connect directly to biome types:
| Climate Pattern | Location | Characteristics | Biomes |
|---|---|---|---|
| Tropical (A) | Near equator | High temperatures & humidity year-round; equatorial type has constant rain, seasonal type has wet/dry seasons | Tropical rainforest, savanna, hot deserts |
| Temperate (C/D) | Mid-latitudes (23.5°–66.5°) | Moderate temps with distinct seasons; maritime (near coast) = mild; continental (inland) = extreme variation | Temperate forests, temperate grasslands |
| Polar (E) | Near poles (66.5°+) | Extremely cold year-round; long harsh winters, short cool summers; minimal precipitation (mostly snow) | Arctic tundra, boreal forest (taiga) |
Subtypes Within Each Pattern
Tropical subtypes: Equatorial (constant rain) vs Seasonal (monsoon — distinct wet/dry). Seasonal tropical climates support savanna and dry deciduous forest.
Temperate subtypes: Maritime temperate (mild, wet — e.g. UK) vs Continental temperate (hot summers, cold winters — e.g. central Europe). Maritime supports temperate rainforest; continental supports mixed forests and grasslands.
Polar subtypes: Tundra (permafrost, no trees) vs Ice cap (permanent ice). Alpine regions at high elevations mimic polar conditions at any latitude.
Secondary Influences & Human InterventionsHL
Temperature and rainfall are primary determinants, but human activities can prevent natural biome development or alter existing biomes:
| Intervention | Mechanism | Consequences | Example |
|---|---|---|---|
| Urbanization | Replaces natural habitat with impermeable surfaces, buildings, infrastructure | Urban heat island effect; habitat fragmentation; disrupted water & nutrient cycles | Tropical forest land → city; biome replaced regardless of climate prediction |
| Agriculture | Replaces diverse natural communities with monoculture crops | Simplified food webs; disrupted N & P cycles; altered soil & water availability | Amazon rainforest → cattle pasture; prairie → wheat fields |
| Deforestation | Removes tree cover, exposing soil and altering local climate | Reduced carbon fixation; increased erosion; changed precipitation patterns | Indonesian peat forest clearance → loss of carbon sink + fire risk |
Key insight: In areas with high human population density (especially temperate and tropical zones), the "natural" biome that climate would produce may no longer exist. What you see is a human-modified landscape, not the climatic potential biome.
The ENSO CycleHL
El Niño
- Warmer-than-average SSTs in central & eastern Pacific
- Weakened or reversed trade winds
- Reduced upwelling off Peru → reduced marine productivity
- Flooding in South America; drought in Australia & Indonesia
- Warmer winters in North America
La Niña
- Cooler-than-average SSTs in central & eastern Pacific
- Strengthened trade winds
- Enhanced upwelling off Peru → increased marine productivity
- Drier in South America; flooding in Australia & Indonesia
- Colder winters in northern US; more Atlantic hurricanes
Neutral & Transitional States
Neutral: SSTs and winds near long-term average; stable, predictable weather. Transitional: Gradual shifts between El Niño and La Niña — weather is variable and unpredictable.
Walker Circulation & UpwellingHL
Normal Conditions (Walker Circulation)
During El Niño
During La Niña
Case Study: Peru
El Niño (1997–98): Collapse of the Peruvian anchovy fishery; severe flooding and landslides; billions in damage. La Niña: Enhanced upwelling restores fish stocks; drier coastal conditions.
Tropical CyclonesHL
Formation & Structure
- Form over warm ocean waters (>26.5 °C) in the tropics
- Feature a calm eye (centre), surrounded by an eyewall (most intense winds & rain), and spiral rainbands
- Rotate counterclockwise (NH) / clockwise (SH) due to the Coriolis effect
- Classified as hurricane/typhoon/cyclone once sustained winds exceed 119 km/hr
Classification by Region
| Name | Region |
|---|---|
| Hurricane | Atlantic Ocean & NE Pacific |
| Typhoon | NW Pacific |
| Cyclone | Indian Ocean & South Pacific |
Impacts
| Hazard | Impact |
|---|---|
| Strong winds | Building damage, infrastructure destruction, debris as projectiles |
| Heavy rainfall | Flooding, landslides (saturated soils), crop destruction |
| Storm surge | Seawater pushed onto coast → coastal flooding & erosion |
Case Studies
- Typhoon Haiyan (2013): Philippines — one of the strongest ever recorded; sustained winds 315 km/hr; >6,000 deaths.
- Hurricane Katrina (2005): US Gulf Coast — fueled by warm Gulf waters; >$125 billion in damage; 1,800+ deaths.
Rising Ocean Temperatures & Storm IntensityHL
The Mechanism
Evidence
- Proportion of Category 4 & 5 hurricanes has increased in recent decades
- North Atlantic has seen a significant rise in named storms since the 1970s
- Accumulated Cyclone Energy (ACE) index shows increasing overall storm activity
- NOAA records show consistent increases in SSTs over the past century, correlating with storm activity
- IPCC reports confirm the link between global warming and increased cyclone intensity
Cascading Impacts
| Impact | Explanation |
|---|---|
| Coastal damage | Stronger storms → more structural damage, accelerated coastal erosion |
| Human displacement | Higher casualties, more evacuations, growing financial burden of recovery |
| Ecosystem destruction | Coral reefs, mangroves devastated → loss of coastal protection & biodiversity |
| Water contamination | Flooding & storm surges spread pollutants, contaminate water supplies |
Essential Vocabulary
| Term | Definition |
|---|---|
| Weather | Short-term atmospheric conditions at a specific time and place |
| Climate | Long-term average of weather conditions (typically 30+ years) for a region |
| Biome | A group of comparable ecosystems sharing similar climatic conditions wherever they occur |
| Insolation | The amount of solar radiation received at a given area |
| Precipitation | Rain, snow, sleet, or hail that falls from the atmosphere to Earth's surface |
| Tricellular model | Model of atmospheric circulation with three cells (Hadley, Ferrel, Polar) per hemisphere |
| Hadley Cell | Equatorial circulation cell — warm air rises at equator, descends at ~30° latitude |
| Ferrel Cell | Mid-latitude (30°–60°) indirect circulation cell driven by adjacent cells |
| Polar Cell | Polar (60°–90°) circulation cell — cold air descends at poles, rises at ~60° |
| ITCZ | Intertropical Convergence Zone — low-pressure band near the equator where trade winds meet |
| Thermohaline circulation | Deep ocean current driven by temperature (thermo-) and salinity (-haline) density differences |
| Coriolis effect | Deflection of moving objects (air, water) by Earth's rotation — right in NH, left in SH |
| Biome shift | Movement of biome boundaries due to changing climate conditions |
| Köppen classification | Climate classification system grouping climates into five types (A–E) based on temperature & rainfall |
HL Key Terms
| Term | Definition |
|---|---|
| ENSO cycle | El Niño Southern Oscillation — fluctuation in wind and SSTs across the tropical Pacific |
| El Niño | Warm phase of ENSO — weakened trade winds, warmer eastern Pacific, reduced upwelling |
| La Niña | Cool phase of ENSO — strengthened trade winds, cooler eastern Pacific, enhanced upwelling |
| Walker circulation | East–west atmospheric circulation across the tropical Pacific driven by SST differences |
| Upwelling | Rising of deep, cold, nutrient-rich water to the ocean surface |
| Stratification | Layering of ocean water by density; warm surface water sits atop cold deep water |
| Tropical cyclone | Rapidly circulating low-pressure storm system forming over warm tropical oceans |
| Hurricane / Typhoon / Cyclone | Regional names for tropical cyclones with sustained winds >119 km/hr |
| ACE index | Accumulated Cyclone Energy — index quantifying total activity of a cyclone season |
Key Takeaways & Exam Tips
Must-Know Relationships
- Insolation → Temperature → Precipitation → Biome: The chain that determines biome distribution.
- Latitude → Cell type → Rainfall pattern → Biome: Link tricellular model to biome locations.
- SST → Walker circulation → Upwelling → Marine productivity: Link ocean dynamics to ecosystem health.
Common Exam Patterns
| Pattern | How to Answer |
|---|---|
| Compare two biomes | Use temperature, rainfall, insolation, NPP, biodiversity, limiting factors |
| Interpret a climate graph | Identify temperature range, precipitation pattern, seasonality → classify biome |
| Explain tricellular model → biome | Trace: cell type at latitude → air movement → rainfall → resulting biome |
| ENSO effects on a region | State phase (El Niño/La Niña) → SST change → upwelling effect → rainfall/weather impact → ecosystem consequence |
| Human impact on biomes | Identify intervention → explain mechanism → describe consequence on biome characteristics |
| Cyclone formation / impact | Conditions (>26.5 °C SST) → structure (eye, eyewall, rainbands) → hazard impacts → case study |
HL-Specific Focus
- Classify climates using the Köppen system (A–E) and predict biomes.
- Explain Walker circulation in normal, El Niño, and La Niña states.
- Discuss how warming SSTs increase cyclone intensity — with evidence (ACE index, Category 4/5 trends).
- Apply knowledge of secondary influences (urbanization, agriculture, deforestation) to explain why biomes differ from climatic predictions.
You've covered all 13 syllabus points ✅
2.4.1 – 2.4.7 (SL) + 2.4.8 – 2.4.13 (HL)