Biodiversity
& Evolution
Subtopic 3.1 — New Syllabus (First Assessment 2026)
Standard Level + Higher Level
What You Need to Know
This subtopic defines biodiversity at multiple levels, explains how evolutionary processes generate and maintain it, introduces quantitative measures, and examines the role of human activity in both reducing and reshaping biodiversity across geological time.
Levels of diversity, resilience, ecosystem complexity
Natural selection, mechanisms of evolution, speciation
Richness, evenness, Simpson's reciprocal index
Artificial selection, geological epochs, mass extinctions
Guiding Questions
- How can diversity be explained and quantified, and why is this important?
- How does the unsustainable use of natural resources impact biodiversity?
Levels of Biodiversity
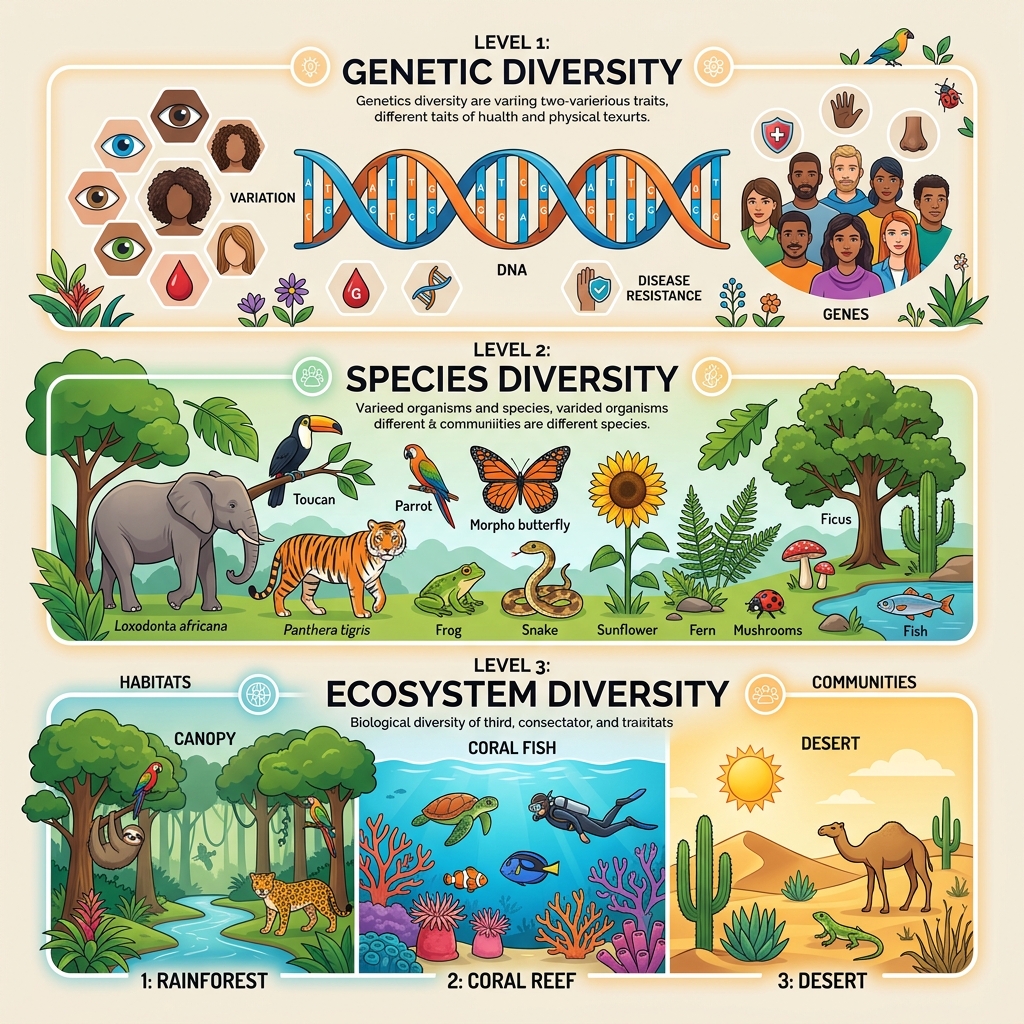
Diversity
Diversity
Diversity
| Level | Definition | Example |
|---|---|---|
| Genetic diversity | Variation of genes within individuals and populations of a species | Cheetahs: low genetic diversity → vulnerable to disease. Coral reefs: high genetic diversity → resilient to temperature changes |
| Species diversity | Number of species (richness) and relative abundance (evenness) in a community | Tropical rainforest: high richness (50% of world's species on 7% of land). Temperate forest: lower richness but critical for ecosystem services |
| Habitat diversity | Variety of physical environments (forests, wetlands, deserts, reefs) in a region | Estuaries: transition between marine and freshwater → many niches → high biodiversity |
Biodiversity & Ecosystem Resilience
Ecosystem resilience — the ability to absorb disturbance and return to equilibrium — depends on biodiversity at all three levels.
| Diversity Level | How It Builds Resilience |
|---|---|
| Genetic | More genetic variation → more chance some individuals survive new threats (disease, climate shift) |
| Species | More species → functional redundancy → if one is lost, others fill its ecological role |
| Habitat | More habitat types → more refugia during disturbance → faster recovery from fire, flood, drought |
Complexity, Feedback & Succession
- Complex food webs: More connections → more alternative energy pathways → greater stability
- Negative feedback loops: Diverse ecosystems have more mechanisms to restore balance after disturbance
- Succession stage: Climax communities (high diversity) are more resilient than pioneer communities (low diversity)
Evolutionary Processes
| Process | Mechanism | Effect on Diversity |
|---|---|---|
| Mutation | Random changes in DNA; most neutral or harmful, some beneficial | Introduces new alleles — raw material for evolution |
| Gene flow | Movement of genes between populations via migration & interbreeding | Increases genetic diversity; reduces differences between populations |
| Genetic drift | Random changes in gene frequencies, especially in small populations | Can reduce diversity; traits may spread or disappear by chance |
| Natural selection | Individuals with advantageous traits survive & reproduce more | Populations adapt to environments; drives speciation over time |
Natural Selection
Organisms better adapted to their environment survive, flourish, and reproduce more successfully than those less well adapted — "survival of the fittest."
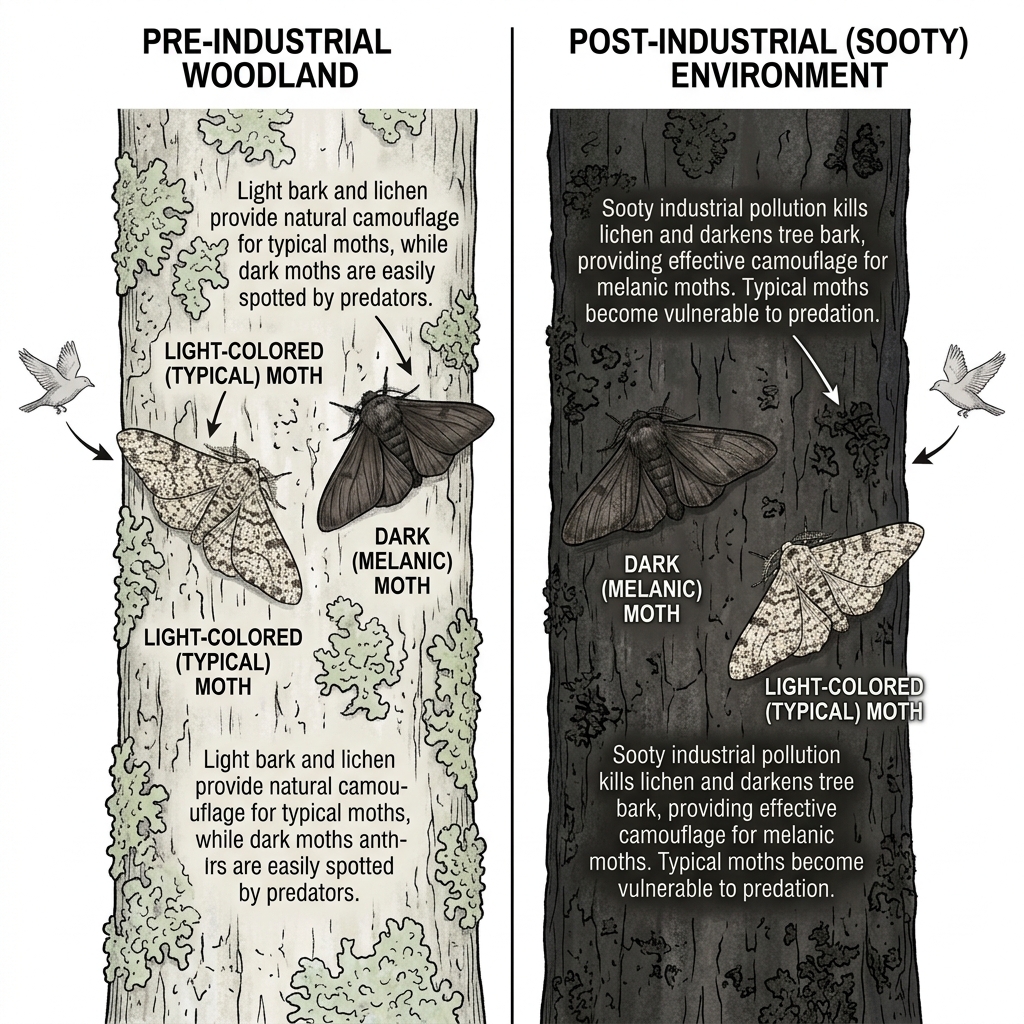
Case Study: The Peppered Moth (Biston betularia)
- Pre-Industrial Revolution: Light-colored moths (typica) dominant — camouflaged against lichen-covered bark. Dark form (carbonaria) rare.
- During Industrial Revolution: Soot darkened tree bark → light moths visible to predators → dark moths favored → population shifted toward carbonaria (industrial melanism)
- Post–Clean Air Acts: Lichen regrew → bark lightened → light moths regained advantage → typica increased again
- Key lesson: When the environment changes, the direction of selection reverses — evidence that natural selection is driven by current conditions.
Mechanisms of Natural Selection
| Step | What Happens | Consequence |
|---|---|---|
| 1. Variation | Individuals differ in traits (size, color, behavior) due to genetic diversity | Provides raw material for selection |
| 2. Overproduction | Species produce more offspring than can survive | Leads to competition for limited resources |
| 3. Competition | Individuals with advantageous traits are more likely to survive | Differential survival based on fitness |
| 4. Differential reproduction | Survivors reproduce more → pass on advantageous traits | Frequency of beneficial alleles increases |
| 5. Heritability | Advantageous traits are inherited by offspring | Population evolves over generations |
Example — beetles: In a population of beetles on dark tree bark, dark-colored individuals are better camouflaged from birds → survive more → reproduce more → over generations, the population shifts toward dark coloration.
Speciation
Speciation occurs when populations of a single species become reproductively isolated, evolve separately, and develop enough genetic divergence that they can no longer interbreed.
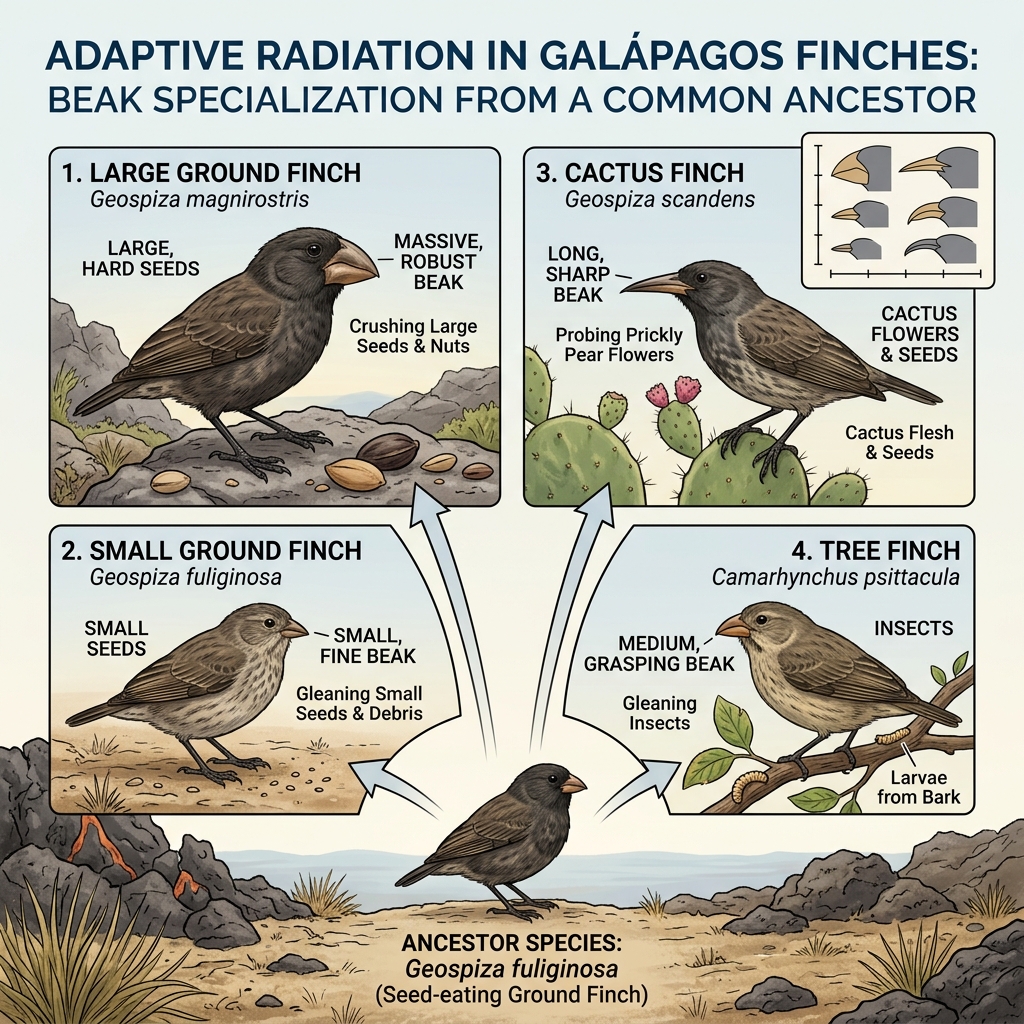
Case Study: Darwin's Finches (Galápagos)
A single immigrant finch species colonized the Galápagos. Geographic isolation on different islands → different food sources → different beak shapes evolved → 13+ distinct species, each adapted to a specific niche. An example of adaptive radiation.
Species Richness & Evenness
| Component | Definition | What It Measures |
|---|---|---|
| Species richness | The total number of different species in an area | How many species are present (not how common they are) |
| Species evenness | The relative abundance of each species | How evenly individuals are distributed among species |
Why Both Matter
- Two ecosystems can have the same richness (e.g. 20 species) but very different evenness
- An ecosystem where one species dominates (low evenness) is less resilient than one with balanced abundances
- High richness + high evenness = maximum diversity = greatest stability and resilience
Simpson's Reciprocal Index
n = number of individuals of each species | N = total number of individuals of all species
Higher 1/D value = greater species diversity
Worked Example
A quadrat sample contains: Species A (40), Species B (35), Species C (25). Total N = 100.
D = (40/100)² + (35/100)² + (25/100)² = 0.16 + 0.1225 + 0.0625 = 0.345
1/D = 1/0.345 ≈ 2.90 → moderate diversity
Biodiversity Knowledge & Conservation
| How Knowledge Is Gathered | Method |
|---|---|
| Citizen science | Public volunteers record species sightings, monitor ecosystems (e.g. bird counts, iNaturalist) |
| Government & NGOs | Remote sensing, field surveys, species monitoring programs (e.g. IUCN Red List assessments) |
| Indigenous & parabiologists | Local ecological knowledge combined with scientific methods; trained community members collect data |
Conservation Strategies Informed by Knowledge
| Strategy | How Knowledge Helps | Example |
|---|---|---|
| Protected areas | Data identifies regions of high ecological value → designated as national parks | Amazon reserves; Great Barrier Reef Marine Park |
| Sustainable management | Biodiversity data informs fishing quotas, forestry practices, water management | MSC-certified sustainable fisheries |
| Species recovery programs | Population & genetic data guides captive breeding and habitat restoration | California condor; black-footed ferret recovery |
Mutation & Sexual ReproductionHL
Mutation
- Random changes in DNA sequence — occur spontaneously during replication or from mutagens
- Beneficial: Improve survival/reproduction → spread over generations
- Neutral / Harmful: Add to gene pool or eliminated by selection
- Ultimate source of all new genetic variation
Sexual Reproduction
- Meiosis: Chromosomes exchange material (recombination) → unique gametes
- Fertilization: Fusion of gametes from 2 parents → unique genotype
- Ensures every individual (except identical twins) is genetically unique
Reproductive IsolationHL
| Type | Mechanism | Example |
|---|---|---|
| Allopatric (geographic) | Physical barrier (mountain, river, ocean) prevents gene flow between populations | Bonobos & chimpanzees: Separated by the Congo River → evolved independently → different social structures and genetics |
| Sympatric (same area) | No physical barrier; isolation by ecological niche or behavioral differences | Apple maggot fly: Shifted to apple trees → different fruiting times → reproductive isolation within generations |
| Parapatric (adjacent) | Continuous range but individuals mate locally; environmental gradient drives divergence | Grass species along a mine toxicity gradient — tolerant and non-tolerant populations diverge |
Island Endemism
- Isolated islands have high endemism (species found nowhere else)
- Galápagos finches: 13+ species from one ancestor
- Madagascar lemurs: ~100 species, all endemic — evolved in isolation for ~60 million years
Uneven Distribution of BiodiversityHL
| Factor | Effect |
|---|---|
| Latitude | Tropical regions (0°–23.5°) have higher species diversity due to stable temperatures and high rainfall |
| Area | Larger habitats support more species (species-area relationship) |
| Evolutionary time | Tropical regions have been climatically stable for longer → more time for speciation |
| Productivity | Higher NPP in tropics → more energy → supports more complex food webs |
Biodiversity Hotspots
- Areas with exceptionally high species richness and endemism under significant threat
- Tropical rainforests: ~50% of world's species on ~7% of Earth's surface
- Coral reefs: "Rainforests of the sea" — structural complexity supports vast marine diversity
- 36 recognized hotspots globally (Conservation International criteria)
Human-Driven Evolutionary ChangeHL
| Human Activity | Selective Pressure | Evolutionary Response |
|---|---|---|
| Hunting / poaching | Targeting individuals with specific traits (e.g. large tusks) | Trait reduction or loss in population |
| Urbanization | New hazards (traffic), altered food sources, novel habitats | Behavioral adaptation (road-crossing, diet shifts) |
| Agriculture | Pesticide use, habitat simplification | Pest resistance to pesticides |
| Climate change | Shifting temperature and precipitation patterns | Range shifts, phenological changes |
Case Study: Tuskless Elephants — Gorongosa, Mozambique
- During civil war poaching, ~90% of elephants were killed → poachers targeted tusked elephants
- Tuskless elephants had survival advantage → tuskless gene frequency increased dramatically
- Demonstrates natural selection driven directly by human selective pressure
Artificial SelectionHL
Humans deliberately breed organisms for desired traits — a process called artificial selection. While commercially useful, it drastically narrows the gene pool.
| Example | What Was Selected | Cost of Reduced Diversity |
|---|---|---|
| Cavendish banana | Size, taste, seedlessness | Genetically identical clones — Panama disease (TR4) threatens global production |
| Commercial wheat | High yield, uniform growth | Vulnerable to new fungal strains; relies on chemical inputs |
| Domestic dog breeds | Appearance, temperament | Inherited health problems (e.g. breathing in bulldogs, hip dysplasia) |
Deep TimeHL
The Scale of Earth History
- 4.5 billion years since Earth formed
- ~3.8 billion years since first life (prokaryotes)
- ~540 million years since the Cambrian Explosion (rapid diversification)
- ~66 million years since the end-Cretaceous mass extinction (dinosaurs extinct)
- ~300,000 years since Homo sapiens appeared — a fraction of a second in geological time
Geological EpochsHL
4500–541 Ma
541–252 Ma
252–66 Ma
66 Ma–present
How epochs are defined: Geologists use boundary markers in rock layers — sudden changes in fossil assemblages, chemical signatures (e.g. iridium layer at the K–Pg boundary), or isotopic ratios. The fossil record is the primary archive of Earth's biological history.
Mass Extinctions & SpeciationHL
The "Big Five" Mass Extinctions
| Event | When (Ma) | Species Lost | Likely Cause |
|---|---|---|---|
| End-Ordovician | ~443 | ~85% | Glaciation, sea-level drop |
| Late Devonian | ~372 | ~75% | Ocean anoxia, volcanism |
| End-Permian | ~252 | ~96% | Volcanism (Siberian Traps), climate change |
| End-Triassic | ~201 | ~80% | Volcanism (CAMP), climate change |
| End-Cretaceous | ~66 | ~76% | Asteroid impact + Deccan Traps volcanism |
The AnthropoceneHL
Evidence for the Anthropocene
| Evidence Type | What It Shows |
|---|---|
| Extinction rate | Current extinction rate is 100–1,000× background rate |
| Nuclear signatures | Global fallout from nuclear weapons testing (1945–1963) leaves detectable marker |
| Plastics & concrete | Novel materials now found in sediment layers worldwide |
| CO₂ levels | Atmospheric CO₂ higher than at any point in 800,000+ years |
| Land use | ~75% of ice-free land significantly altered by human activity |
Planetary-Scale Human ImpactsHL
| Human Impact | Geological Signature | Persistence |
|---|---|---|
| CO₂ emissions | Carbon isotope shift (δ¹³C) in sediments; ocean acidification layers | 100,000+ years |
| Plastic pollution | Plastic fragments in sedimentary layers worldwide | Millions of years |
| Nuclear fallout | Radioactive isotopes (Pu-239) in global sediment layers | Tens of thousands of years |
| Species extinction | Sudden disappearance of species in fossil record | Permanent |
Essential Vocabulary
| Term | Definition |
|---|---|
| Biodiversity | The total diversity of living systems — genetic, species, and habitat levels |
| Genetic diversity | Variation of genes within individuals and populations of a species |
| Species diversity | The number of species (richness) and their relative abundance (evenness) |
| Habitat diversity | The variety of physical environments in a region |
| Resilience | An ecosystem's ability to absorb disturbance and recover to equilibrium |
| Natural selection | Individuals with advantageous traits survive and reproduce more |
| Speciation | Generation of new species through evolution and reproductive isolation |
| Species richness | The number of different species in an area |
| Species evenness | The relative abundance of each species in a community |
| Simpson's index (1/D) | Quantitative measure of species diversity; higher = more diverse |
| Anthropocene | Proposed geological epoch defined by human-dominated environmental change |
Key Takeaways & Exam Tips
Must-Know Relationships
- Genetic → Species → Habitat diversity: Nested levels; loss at any level weakens the system
- Diversity → Resilience: More species + more genetic variation = more functional redundancy
- 5 steps of natural selection: Variation, overproduction, competition, differential reproduction, heritability
- Isolation → Divergence → Reproductive isolation = speciation
- Richness + Evenness = Species diversity — Simpson's index quantifies both
You've covered all 19 syllabus points ✅
3.1.1 – 3.1.9 (SL) + 3.1.10 – 3.1.19 (HL)