IB DP Environmental Systems & Societies — Topic 4: Water
Water Systems
Subtopic 4.1 — New Syllabus (First Assessment 2026)
Standard Level + Higher Level
6 SL Points
4.1.1 – 4.1.6
8 HL Extensions
4.1.7 – 4.1.14
Overview
What You Need to Know
This subtopic models the hydrological cycle as a system, examines how human activities alter water stores and flows, and — at HL — explores water's unique properties, the ocean as a carbon sink, stratification, and thermohaline circulation.
A. The Hydrological Cycle
Solar radiation & gravity, stores & flows, water budget
B. Human Impacts
Agriculture, deforestation, urbanization, steady-state diagrams
C. Properties & Oceans (HL)
Unique properties, carbon sink, stratification, thermohaline circulation
Guiding Questions
- How can natural systems be modeled, and can these models predict the effects of human disturbance?
- How do water systems support life on Earth, and how do they interact with other systems such as the carbon cycle?
- How do human activities alter the natural flow of water systems?
Time allocation: minimum 2 hours SL + additional 3 hours HL. First subtopic in Topic 4: Water.
4.1.1
Driving Forces of the Water Cycle
Key UnderstandingMovements of water in the hydrosphere are driven by solar radiation and gravity.
☀️ Solar radiation
→ Evaporation & Transpiration
→
☁️ Condensation
→ Cloud formation
→
🌧️ Precipitation
+ Gravity → Runoff & Infiltration
☀️ Solar Radiation
- Heats surface water → molecules gain thermal energy → liquid to gas (evaporation)
- Drives transpiration from plant leaves
- Warm vapor rises → cools → condenses into clouds, releasing latent heat that powers weather systems
⬇️ Gravity
- Pulls precipitation down from clouds to land and oceans
- Drives surface runoff downhill into rivers, lakes, and oceans
- Pulls water downward into soil (infiltration) and deep rock layers (percolation)
4.1.2 & 4.1.3
Hydrological Cycle as a System & Water Stores
Key UnderstandingThe global hydrological cycle operates as a system with stores and flows. Oceans contain 96.5%, glaciers 1.7%, groundwater 1.7%, surface freshwater 0.02%, atmosphere 0.001%, organisms 0.0001%.
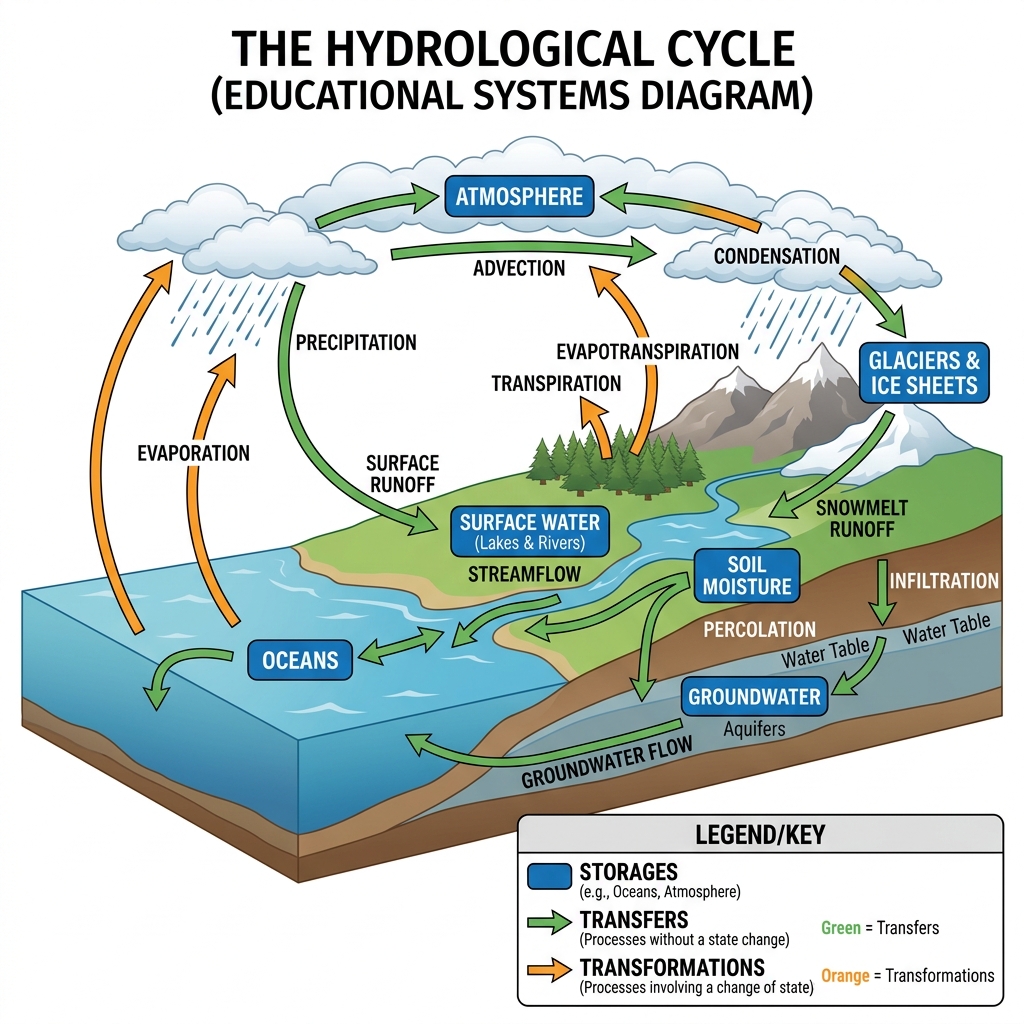
| Store | % of Total Water | Key Characteristics |
|---|
| Oceans | 96.5% | ~1.35 billion km³; primary saltwater reservoir & evaporation source |
| Glaciers & ice caps | 1.7% | ~69% of Earth's freshwater; long-term ice storage (Antarctica, Greenland) |
| Groundwater | 1.7% | Stored in aquifers; vital for global agriculture & drinking water |
| Surface freshwater | 0.02% | Rivers, lakes, wetlands; accessible to ecosystems, small volume |
| Atmosphere | 0.001% | Water vapor & clouds; rapid turnover (~9 days), drives global moisture transport |
| Organisms | 0.0001% | Water in biomass; enables cell metabolism, photosynthesis, and respiration |
Key takeaway: Less than 1% of all water on Earth is readily accessible freshwater for human consumption and terrestrial ecosystems.
4.1.4
Flows in the Hydrological Cycle
Key UnderstandingFlows in the hydrological cycle include transpiration, sublimation, evaporation, condensation, advection, precipitation, melting, freezing, surface run-off, infiltration, percolation, streamflow and groundwater flow.
| Flow | Type | Description |
|---|
| Evaporation | Transformation | Liquid water → vapor from water bodies |
| Transpiration | Transformation | Water vapor released by plants via stomata |
| Evapotranspiration | Combined | Total water lost to atmosphere (evaporation + transpiration) |
| Sublimation | Transformation | Ice/snow → vapor directly without melting (polar/alpine) |
| Condensation | Transformation | Vapor → liquid droplets forming clouds; releases latent heat |
| Advection | Transfer | Horizontal movement of atmospheric moisture by wind |
| Precipitation | Transfer | Rain, snow, hail falling under gravity |
| Surface run-off | Transfer | Water flowing across land into streams and oceans |
| Infiltration & Percolation | Transfer | Water entering topsoil (infiltration) and moving to aquifers (percolation) |
Exam distinction: Transfer flows move water without changing its state (runoff, infiltration, advection). Transformation flows change water's state (evaporation, condensation, freezing, melting, sublimation).
4.1.5
Human Impacts on the Water Cycle
Key UnderstandingHuman activities, such as agriculture, deforestation and urbanization, can alter these flows and stores.
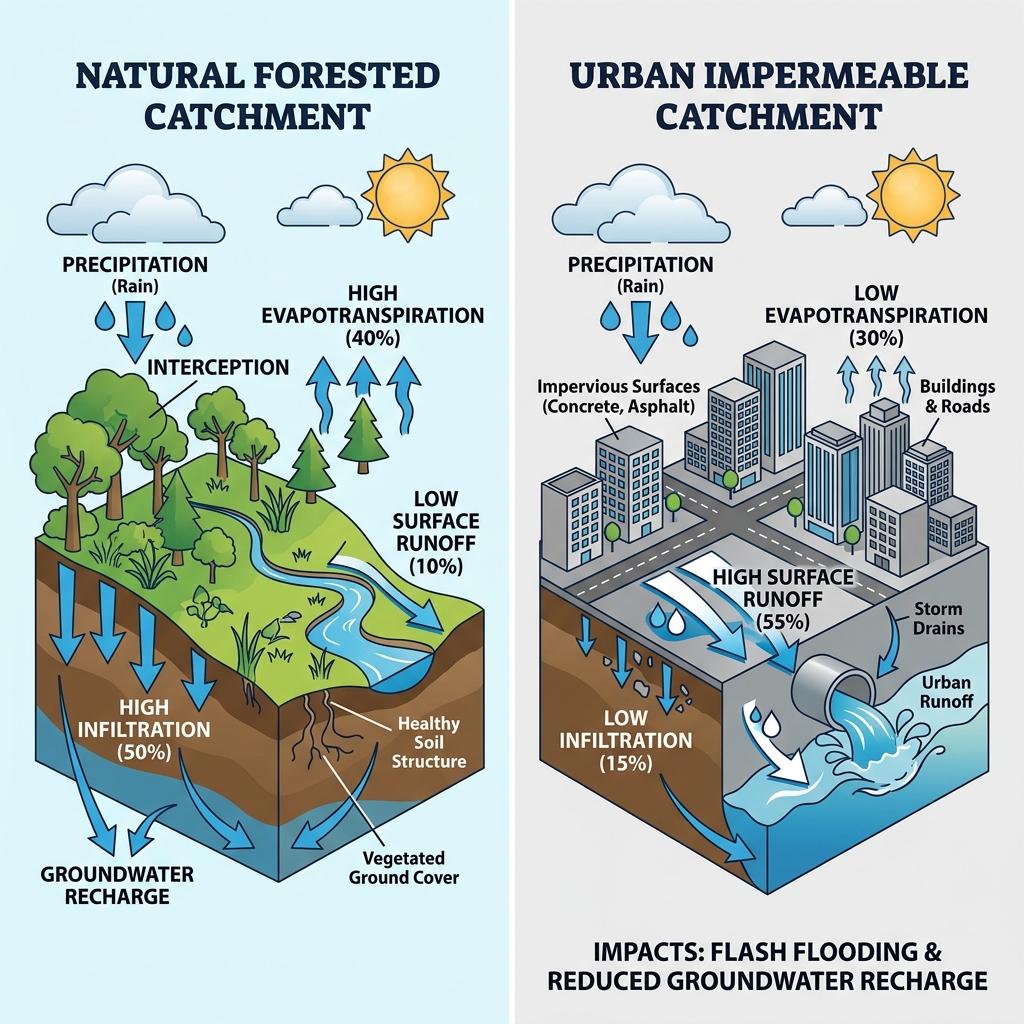
| Activity | Changes to Flows & Stores | Environmental Consequence |
|---|
| Urbanization | Impermeable concrete/asphalt → ↓ infiltration, ↓ evapotranspiration, ↑ surface runoff | Increased flash flooding risk, severe erosion, groundwater depletion, stormwater pollution |
| Deforestation | Tree clearance → ↓ transpiration & canopy interception, root loss → ↓ infiltration | Reduced local rainfall, increased surface runoff, topsoil loss, river siltation |
| Agriculture | Irrigation diversion, heavy machinery soil compaction, synthetic fertilizer run-off | Aquifer overdraft, soil salinization, eutrophication of downstream aquatic habitats |
4.1.6
Steady State & Flow Diagrams
Key UnderstandingThe steady state of any water body can be demonstrated through flow diagrams of inputs and outputs.
A water store is in steady-state equilibrium when total inputs equal total outputs over time. When outputs exceed inputs, the store depletes.
🌧️ Inputs
Precipitation + Recharge + Inflows
→
💧 Water Body Store
(Aquifer / Lake)
→
☀️ Outputs
Evaporation + Outflows + Human Extraction
Worked Calculation: Sustainable Aquifer Yield
An aquifer receives 100 million m³/year recharge from precipitation and river seepage.
Natural discharge to springs and wetlands = 60 million m³/year.
Maximum Sustainable Yield = 100 − 60 = 40 million m³/year.
If agricultural pumping exceeds 40 million m³/year, the water table drops, causing land subsidence and aquifer collapse (e.g. California's Central Valley, Ogallala Aquifer).
HL — 4.1.7
Unique Properties of WaterHL
Key UnderstandingWater has unique physical and chemical properties that support and sustain life.
🔬 Polarity & Universal Solvent
Hydrogen bonding makes water a supreme solvent, dissolving nutrients, minerals, and waste for biological transport.
💧 Cohesion & Adhesion
Cohesion (surface tension) & adhesion enable capillary action, drawing water up plant xylem tall trees against gravity.
🌡️ High Specific Heat Capacity
Absorbs large amounts of heat with minimal temperature change, buffering aquatic organisms and global climate.
🧊 Density Anomaly (Max at 4°C)
Ice is less dense than liquid water and floats, insulating liquid water below so aquatic life survives winter freezing.
Density Anomaly Exam Note: If ice sank, oceans and lakes would freeze solid from the bottom up, destroying aquatic ecosystems.
HL — 4.1.8 & 4.1.9
Oceans as Carbon Sinks & Sequestration TimescalesHL
Key UnderstandingOceans absorb ~25–30% of anthropogenic CO₂. Short-term absorption causes ocean acidification; long-term sequestration stores carbon in biomass and seabed sediment.
⚡ Short-Term: Ocean Acidification
CO₂ dissolves in surface water forming carbonic acid (H₂CO₃), lowering pH and reducing carbonate ions needed by corals, pteropods, and shellfish to form shells.
🕐 Long-Term: Biological & Physical Pumps
Phytoplankton fix CO₂ via photosynthesis. When they die, organic carbon sinks to the deep ocean floor (biological pump), locking carbon in marine sediments for millennia.
Saturation & Warming Threat
Warmer water holds less dissolved gas. As sea surface temperatures rise, ocean CO₂ absorption capacity decreases, leaving more CO₂ in the atmosphere to accelerate warming.
HL — 4.1.10 & 4.1.11
Thermal Stratification & The ThermoclineHL
Key UnderstandingTemperature varies with depth, creating layers (epilimnion, thermocline, hypolimnion). Density differences restrict mixing, creating persistent thermal stratification.
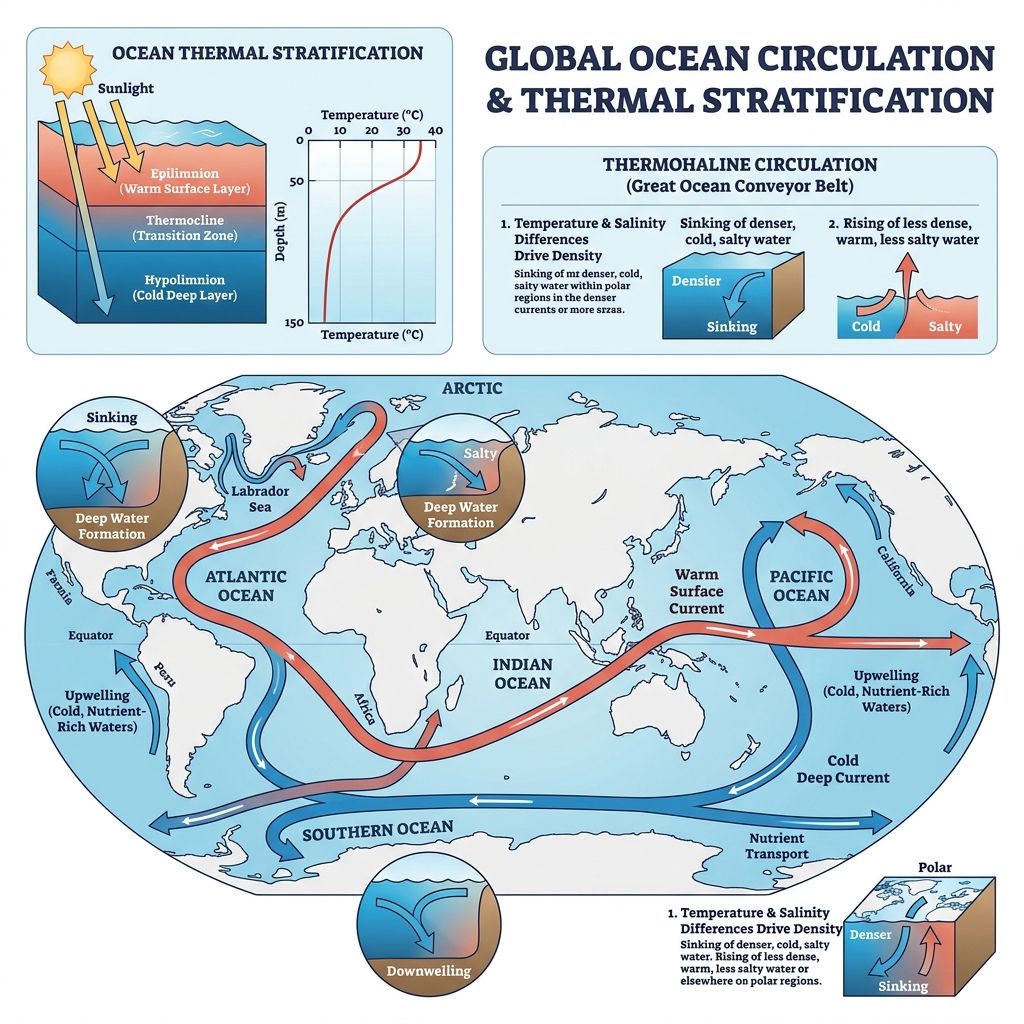
| Water Layer | Depth & Temp | Oxygen & Nutrient Characteristics |
|---|
| Epilimnion | Surface warm layer | High dissolved O₂ (photosynthesis + atmosphere contact), low nutrients (consumed by plankton) |
| Thermocline | Middle boundary layer | Zone of rapid temperature and density decrease with depth |
| Hypolimnion | Deep cold layer (~4°C) | Low dissolved O₂ (no light/photosynthesis), high nutrients (accumulated from sinking organic decay) |
Ecological consequence: Stratification prevents deep nutrient-rich water from reaching sunlit surface layers, limiting primary productivity unless seasonal turnover or upwelling occurs.
HL — 4.1.12
Climate Change & StratificationHL
Key UnderstandingGlobal warming and salinity changes have increased the intensity of ocean stratification.
🌡️ Surface warming + Melting polar ice
→
⬆️ Stronger density gradient
→
🚫 Reduced vertical mixing
Cascade of Consequences
- Surface nutrient starvation: Phytoplankton lack nutrients → decline in marine food webs
- Deep ocean deoxygenation: Less oxygen transported downward → expanding hypoxic "dead zones"
- Reduced carbon uptake: Surface water saturates faster → oceans absorb less atmospheric CO₂
HL — 4.1.13
UpwellingsHL
Key UnderstandingUpwellings in oceans and freshwater bodies can bring cold, nutrient-rich waters to the surface.
Winds pushing surface water offshore trigger deep, cold, nutrient-rich water to rise to the sunlit surface layer.
🐟 High Ecological Productivity
Nutrient surges fuel massive phytoplankton blooms, supporting world-famous fisheries like the Humboldt Current off Peru and California Current.
🌀 El Niño Disruption
During El Niño events, trade winds weaken → upwelling stops → surface nutrients collapse → massive fish mortality and seabird starvation.
HL — 4.1.14
Thermohaline CirculationHL
Key UnderstandingThermohaline circulation systems are driven by temperature and salinity density differences, driving the global ocean conveyor belt that distributes heat and affects climate.
The Global Ocean Conveyor Belt
- Cold, salty water in the North Atlantic becomes dense and sinks (North Atlantic Deep Water)
- Deep currents flow south toward Antarctica and into the Pacific/Indian Oceans
- Water slowly upwells in warm tropical regions, returning via surface currents
- Transports massive amounts of tropical heat to North Western Europe, keeping it 5–10°C warmer
AMOC Slowdown Risk
Melting Greenland ice adds vast amounts of buoyant freshwater to the North Atlantic, reducing salinity and preventing water from sinking. This threatens to slow or collapse the Atlantic Meridional Overturning Circulation (AMOC), with severe global climate consequences.
Key Terms Glossary
Essential Vocabulary
| Term | Definition |
|---|
| Hydrosphere | All water on Earth (oceans, ice, groundwater, atmosphere, biota) |
| Hydrological Cycle | Continuous movement of water driven by solar energy and gravity |
| Evapotranspiration | Combined total water loss to atmosphere via evaporation + plant transpiration |
| Infiltration / Percolation | Entry of water into topsoil (infiltration) and downward movement through rock into aquifers (percolation) |
| Steady-State Equilibrium | Condition where inputs to a store equal outputs over time |
| Maximum Sustainable Yield | Max extraction rate that maintains steady-state storage without depletion |
| Specific Heat Capacity | Heat energy required to raise water temperature — buffers climate and aquatic life |
| Density Anomaly | Water is densest at 4°C; ice floats, insulating underlying aquatic habitats |
| Thermocline | Layer of rapid temperature change separating warm epilimnion from cold hypolimnion |
| Upwelling | Wind-driven displacement of surface water bringing cold, nutrient-rich deep water upward |
| Thermohaline Circulation | Global ocean conveyor belt driven by temperature and salinity density gradients |
Exam Preparation
Key Takeaways & Exam Tips
Must-Know Concepts
- Energy drivers: Solar radiation drives evaporation/transpiration; gravity drives runoff/precipitation/infiltration.
- Human catchments: Urbanization increases surface runoff & flood risk while decreasing groundwater recharge.
- Sustainable yield math: Sustainable Yield = Inputs − Natural Outputs.
- HL Physics & Oceans: Density anomaly protects winter aquatic life; thermohaline circulation redistributes global heat; ocean stratification blocks nutrient mixing.
Exam tip: On 9-mark essay questions, connect human catchment modifications (4.1.5) to water security (4.2) and climate change feedbacks (4.1.12).
You've covered all 14 syllabus points ✅
4.1.1 – 4.1.6 (SL) + 4.1.7 – 4.1.14 (HL)