IB DP Environmental Systems & Societies — Topic 4: Water
Water Pollution
Subtopic 4.4 — New Syllabus (First Assessment 2026)
Standard Level + Higher Level
8 SL Points
4.4.1 – 4.4.8
9 HL Extensions
4.4.9 – 4.4.17
Overview
What You Need to Know
This subtopic covers sources and impacts of water pollution, plastic debris, water quality measurement, BOD, eutrophication (process, impacts, management), and — at HL — specific pollutants, algal toxins, sewage treatment, indicator species, biotic indices, WHO guidelines, and citizen action.
A. Sources & Plastics
Point vs non-point, microplastics, ocean gyres, supply-chain bans
B. Quality & Eutrophication
BOD, algal blooms, hypoxia & dead zones, 3 management levels
C. Sewage & Biotic Indices (HL)
3-stage sewage treatment, indicator species, biotic index, WHO standards
Guiding Questions
- How does pollution affect the sustainability of environmental systems?
- How do different perspectives affect how pollution is managed?
Time allocation: minimum 4 hours SL + additional 4 hours HL. Final subtopic in Topic 4: Water.
4.4.1
Sources of Water Pollution
Key UnderstandingWater pollution has multiple sources (point and non-point) and has major impacts on aquatic ecosystems.
📍 Point Source
Traced to a single, discrete, identifiable location (e.g. factory discharge pipe, municipal sewage outfall, oil spill).
🌫️ Non-Point Source
Originates from diffuse, wide-spread areas (e.g. agricultural fertilizer runoff, urban stormwater, atmospheric acid deposition).
| Category | Primary Sources | Key Pollutants & Impacts |
|---|
| Agricultural | Crop fertilizer runoff, livestock manure | Nitrates, phosphates, pathogens $\rightarrow$ Eutrophication |
| Industrial | Factories, mining operations | Heavy metals (mercury, lead), acid mine drainage |
| Municipal | Domestic sewage, urban roads | Organic waste, microplastics, oil, detergent surfactants |
4.4.2
Plastic Pollution & Ocean Gyres
Key UnderstandingPlastic debris accumulates in marine gyres, causing entanglement, ingestion, microplastic bioaccumulation, and toxin transport.
🐢 Macroplastic Hazards
Sea turtles ingest plastic bags (confusing them with jellyfish); ghost fishing nets entangle marine mammals and seabirds.
🔬 Microplastics (<5 mm)
Ingested by zooplankton and fish. Bioaccumulate in organisms and biomagnify up the food chain, carrying adsorbed POP toxins.
Management Interventions
- Supply Chain Bans: Banning single-use plastics and micro-beads in cosmetics (EU directives).
- Extended Producer Responsibility (EPR): Mandating manufacturers fund plastic collection & recycling.
- Cleanup Innovations: Deploying ocean barriers in high-density gyres (e.g. Ocean Cleanup Project).
4.4.3 & 4.4.4
Measuring Water Quality & BOD
Key UnderstandingWater quality is measured via direct parameters (pH, DO, temperature) and indirect biological parameters like Biochemical Oxygen Demand (BOD).
🧪 BOD Formula & Test Procedure
$$\text{BOD} = \text{DO}_{\text{initial}} - \text{DO}_{\text{final after 5 days in dark at 20°C}} \quad (\text{mg/L})$$
High BOD indicates heavy organic pollution (sewage, manure). Decomposing aerobic bacteria rapidly consume dissolved oxygen.
| BOD Value | Water Quality Status | Typical Sources |
|---|
| < 1 mg/L | Very Clean | Unpolluted pristine mountain streams |
| 1 – 2 mg/L | Fairly Clean | Moderate natural organic matter |
| 3 – 5 mg/L | Moderately Polluted | Agricultural runoff, urban stormwater |
| > 5 mg/L | Heavily Polluted | Raw municipal sewage, factory effluent |
4.4.5 & 4.4.6
Eutrophication & Hypoxic Dead Zones
Key UnderstandingEutrophication is the excessive nutrient enrichment of water bodies, causing algal blooms, light blockage, bacterial decomposition, high BOD, and hypoxia.
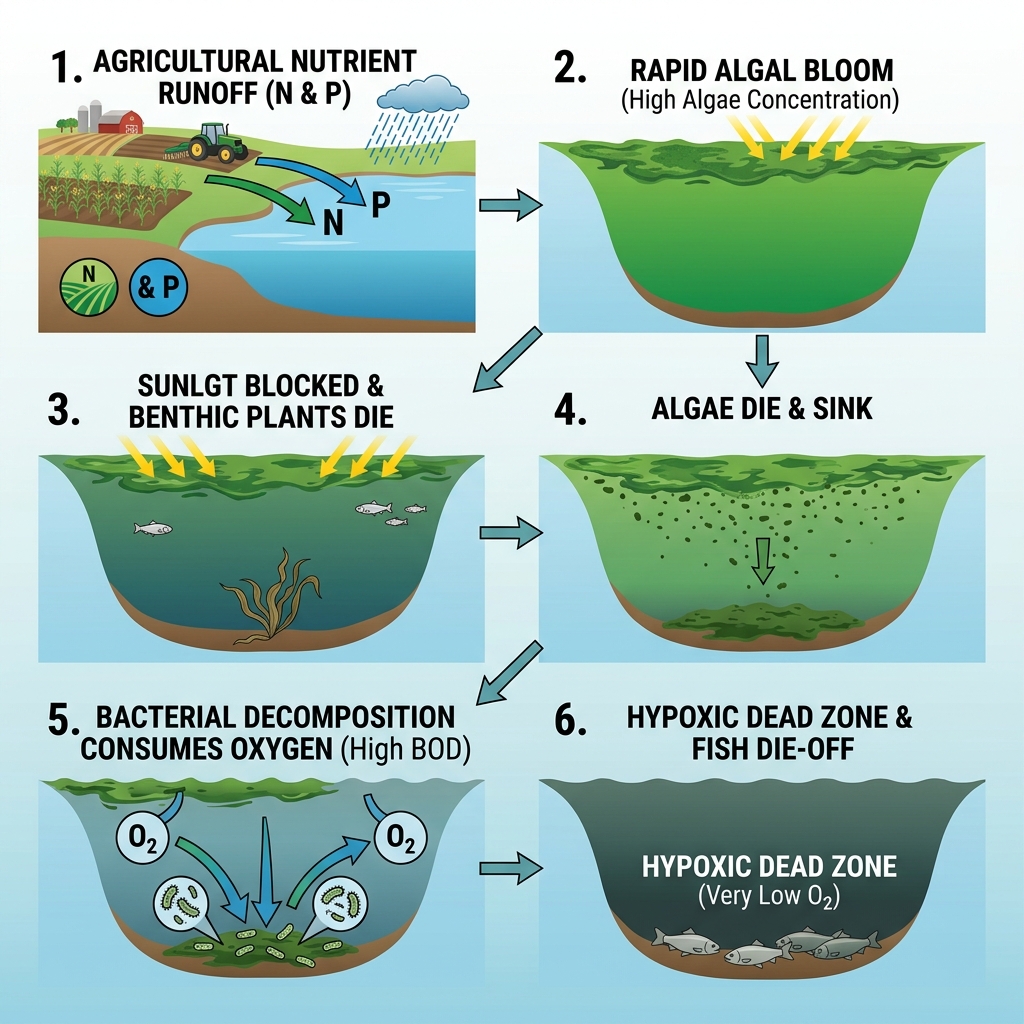
🌾 Nutrient Runoff ($\text{N, P}$)
→
🌿 Algal Bloom
→
☀️ Light Blocked
→
🦠 Bacterial Decay (↑BOD)
→
☠️ Hypoxic Dead Zone
4.4.7 & 4.4.8
Impacts & 3-Level Management Model
Key UnderstandingEutrophication damages ecosystem services. Pollution can be managed across 3 levels: human behavior alteration, release regulation, and ecosystem restoration.
| Management Level | Strategy Objective | Practical Actions & Examples |
|---|
| Level 1: Altering Human Activity | Reduce pollutant production at source | Adopt organic farming, precision fertilizer application, phosphate-free detergents |
| Level 2: Regulating Release | Control pollutant entry into waterways | Construct riparian buffer strips, wetlands, enforce tertiary sewage treatment |
| Level 3: Clean-up & Restoration | Rehabilitate damaged ecosystems | Dredge nutrient-laden lake sediment, pump oxygen into hypoxic zones, apply algaecides |
Case Study: Gulf of Mexico Hypoxic Zone
Agricultural runoff carrying excess nitrogen down the Mississippi River creates a 15,000+ km² dead zone in the Gulf of Mexico every summer, devastating commercial shrimp and fish catches.
HL — 4.4.9 & 4.4.10
Specific Pollutants & Harmful Algal Blooms (HABs)HL
Key UnderstandingWater pollutants include POPs, heavy metals, TBT, and pharmaceuticals. Eutrophication can trigger toxic Harmful Algal Blooms.
☠️ Chemical Pollutant Risks
- POPs & Heavy Metals: DDT, PCBs, Mercury bioaccumulate in fat and biomagnify to top predators
- TBT (Tributyltin): Anti-fouling boat paint component causing imposex (gender alteration) in marine snails
⚠️ Toxic Algal Blooms
- Cyanobacteria produce microcystins (liver toxins)
- Alexandrium dinoflagellates produce saxitoxin, causing Paralytic Shellfish Poisoning (PSP) in humans
HL — 4.4.12
3-Stage Sewage Treatment PlantHL
Key UnderstandingSewage treatment removes solids, organic matter, and nutrients across primary, secondary, and tertiary stages before safe discharge.
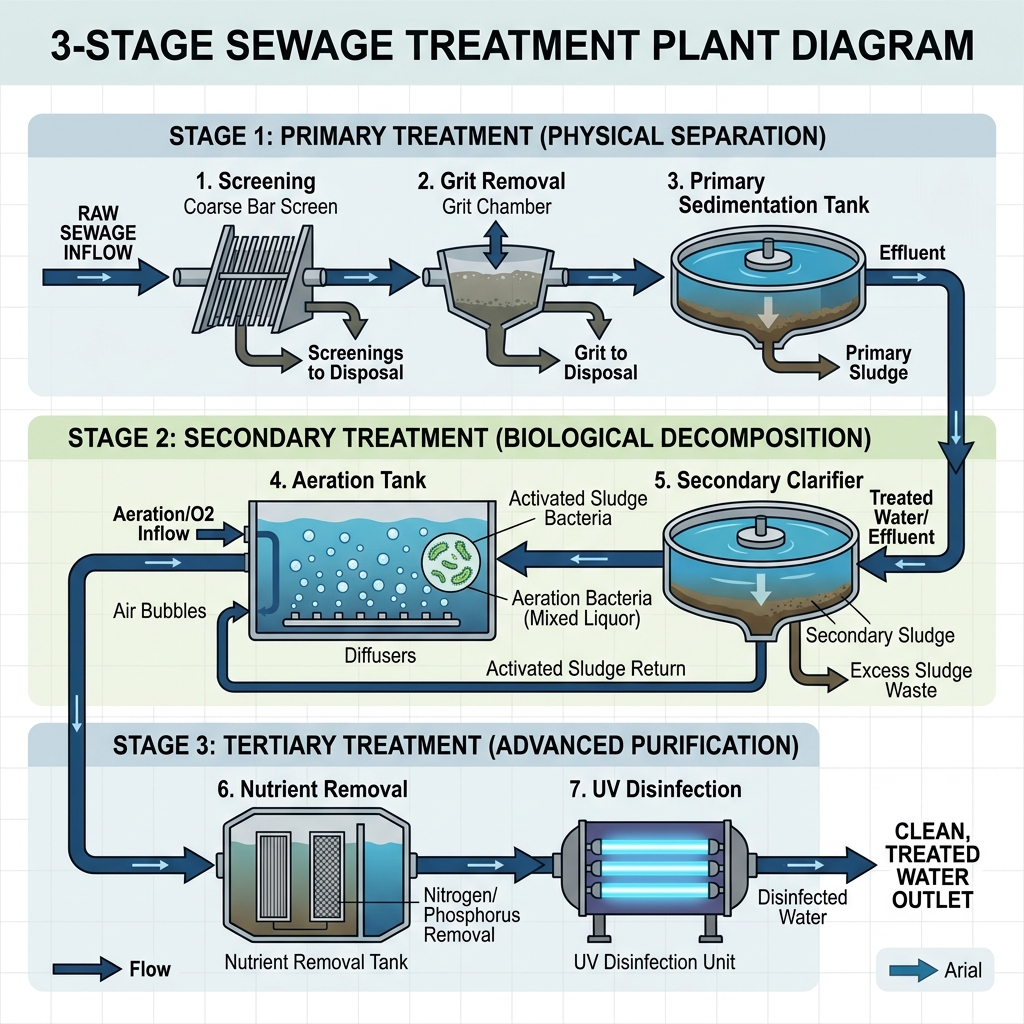
| Treatment Stage | Process Mechanism | Target Removed |
|---|
| Primary (Physical) | Screening bar filters + sedimentation settling tanks | Large debris, sticks, rags, heavy grit, floating grease |
| Secondary (Biological) | Aeration tanks with activated sludge aerobic bacteria | Dissolved organic matter ($\text{BOD}$ reduced by ~90%) |
| Tertiary (Advanced/Chemical) | Nutrient precipitation tanks + UV / Chlorination disinfection | Phosphates, nitrates, micro-pathogens & viruses |
HL — 4.4.13 & 4.4.14
Indicator Species & Biotic IndicesHL
Key UnderstandingIndicator species presence and abundance allow calculation of a Biotic Index, providing an indirect long-term measure of water quality.
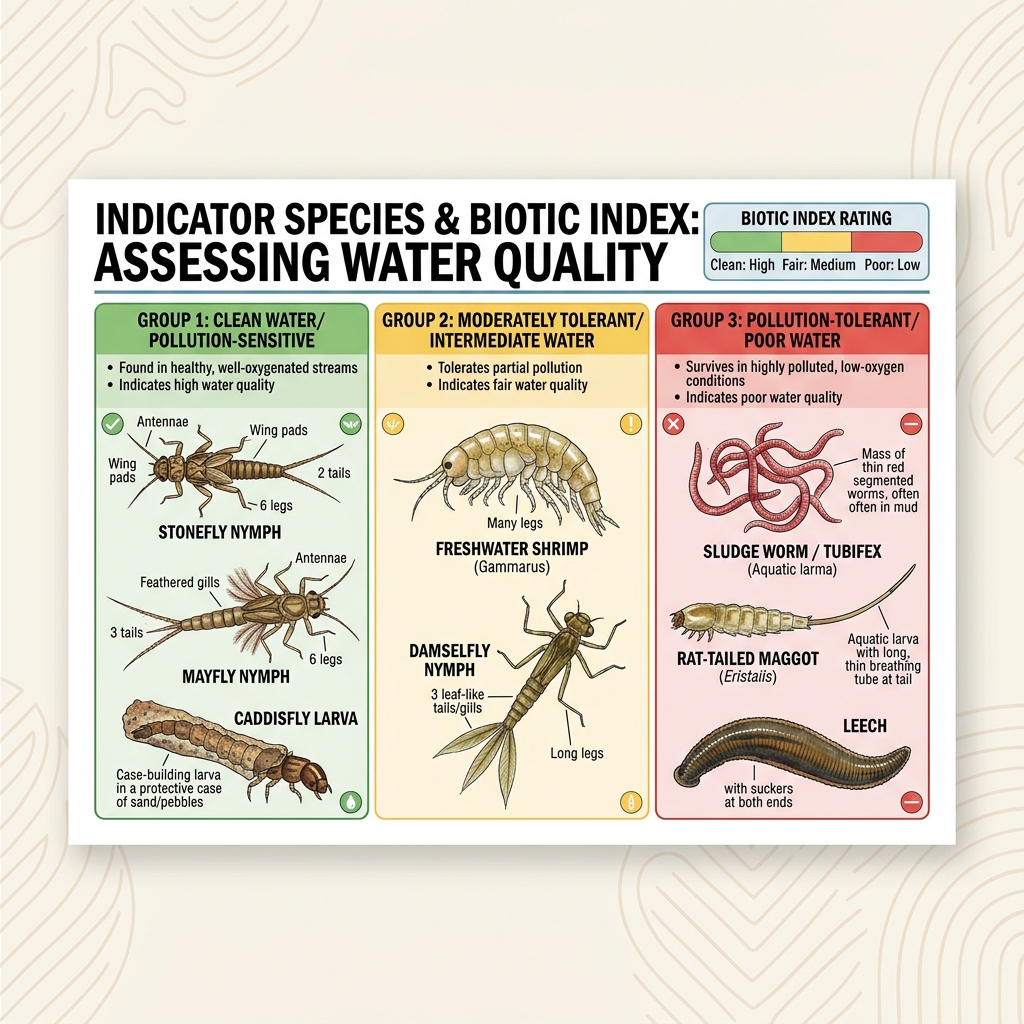
| Tolerance Category | Representative Macroinvertebrates | Water Quality Indication |
|---|
| Pollution-Sensitive | Stonefly nymph, Mayfly nymph, Caddisfly larva | Clean, well-oxygenated water (High Biotic Score) |
| Intermediate Tolerance | Freshwater shrimp (Gammarus), Damselfly nymph | Moderately polluted / Fair water quality |
| Pollution-Tolerant | Sludge worm (Tubifex), Rat-tailed maggot, Leech | Heavily polluted, hypoxic water (Low Biotic Score) |
HL — 4.4.15 – 4.4.17
WQI, WHO Standards & Citizen ActionHL
Key UnderstandingWater Quality Index (WQI) synthesizes data. WHO sets global guidelines. Citizen science empowers local stream monitoring and advocacy.
📋 WHO Drinking Guidelines
Sets international safe limits ($E. coli = 0 / 100\text{mL}$, $\text{Nitrates} < 50\text{ mg/L}$). Local governments enforce statutory national drinking standards.
👥 Citizen Science & Action
Volunteer monitoring networks (e.g. FreshwaterWatch) gather river data, identify pollution outfalls, and lobby for legislative enforcement.
Key Terms Glossary
Essential Vocabulary
| Term | Definition |
|---|
| Point Source | Pollution originating from a single, identifiable outlet (pipe, spill site) |
| Non-Point Source | Pollution from diffuse, widespread areas (agricultural runoff, urban roads) |
| Microplastics | Plastic fragments smaller than 5 mm that bioaccumulate in marine life |
| BOD | Biochemical Oxygen Demand: $\text{DO}_{\text{initial}} - \text{DO}_{\text{final}}$ after 5 days at 20°C in dark |
| Eutrophication | Nutrient enrichment ($\text{N, P}$) driving algal blooms, high BOD, and hypoxia |
| Hypoxia / Anoxia | Low ($\text{DO} < 2\text{ mg/L}$) or zero oxygen conditions resulting in dead zones |
| Indicator Species | Organisms whose presence/absence indicates specific environmental quality |
| Biotic Index | Scale assessing ecosystem health based on macroinvertebrate pollution tolerance |
| Activated Sludge | Secondary sewage treatment process using aerobic bacteria to decompose organic waste |
Exam Preparation
Key Takeaways & Exam Tips
Must-Know Concepts
- Full Eutrophication Chain: Nutrient runoff $\rightarrow$ Algal bloom $\rightarrow$ Light blocked $\rightarrow$ Plants die $\rightarrow$ Bacterial decay $\rightarrow$ High BOD $\rightarrow$ Hypoxia.
- BOD Calculation: $\text{DO}_{\text{initial}} - \text{DO}_{\text{final}}$. High value = polluted water.
- 3 Sewage Stages: Primary = physical separation; Secondary = biological breakdown; Tertiary = chemical nutrient & pathogen removal.
- Indicator Species: Stoneflies = clean water; Tubifex worms = organic pollution.
Exam tip: When evaluating eutrophication management in 9-mark essay questions, frame your response using the 3-level pollution management framework (Alter Activity $\rightarrow$ Regulate Release $\rightarrow$ Restore System).
You've covered all 17 syllabus points ✅
4.4.1 – 4.4.8 (SL) + 4.4.9 – 4.4.17 (HL) · Complete Topic 4: Water!