IB DP Environmental Systems & Societies — Topic 6: Atmosphere
Climate Change:
Causes & Impacts
Subtopic 6.2 — New Syllabus (First Assessment 2026)
Standard Level + Higher Level
7 SL Points
6.2.1 – 6.2.7
2 HL Extensions
6.2.8 – 6.2.9
Overview
What You Need to Know
This subtopic examines the evidence for anthropogenic climate change, industrial drivers ($\text{CO}_2, \text{CH}_4, \text{N}_2\text{O}$), proxy data (ice cores), ecological and societal impacts, feedback mechanisms, and — at HL — the climate change planetary boundary and geopolitical perspectives.
A. System & Proxy Evidence
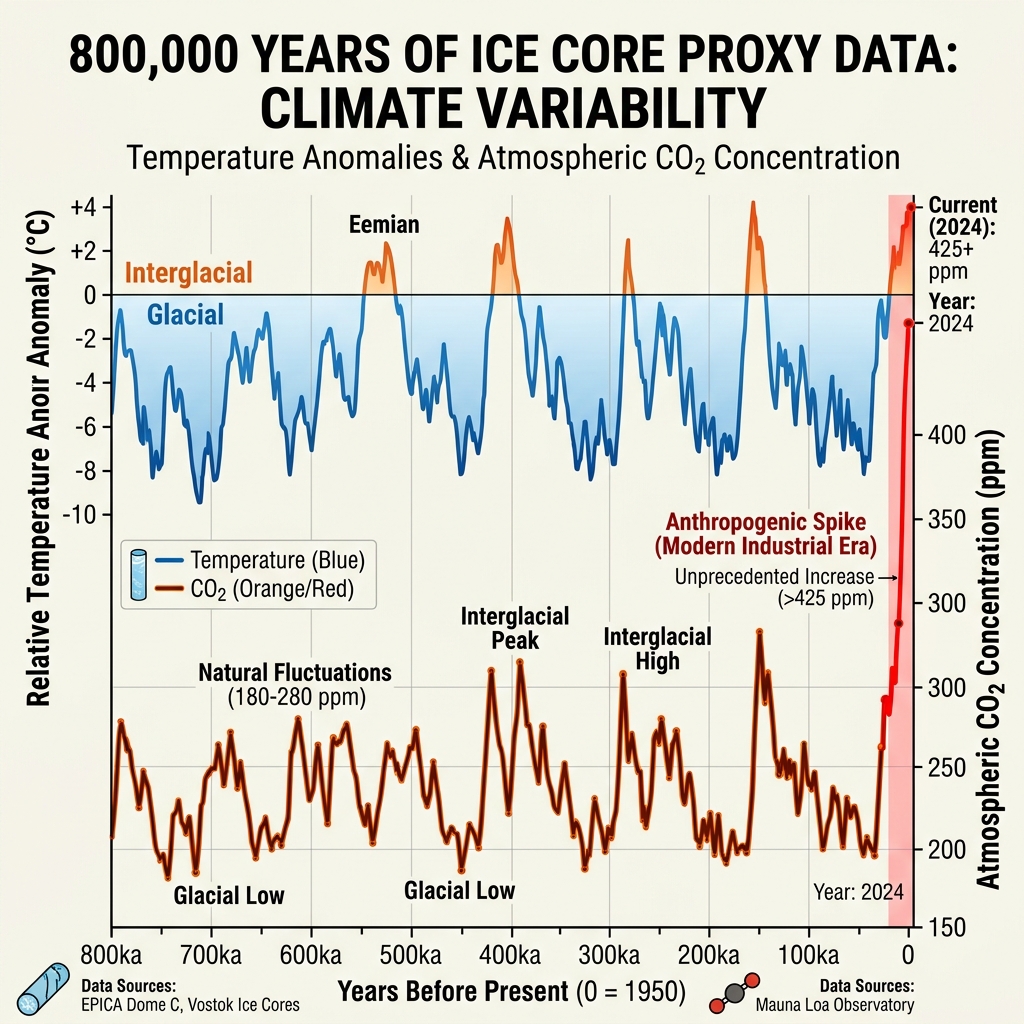
800k-year Vostok ice cores, Keeling Curve, post-1950 acceleration
B. Ecological & Societal Impacts
Coral bleaching, sea level rise, biome shifts, water/food security
C. Feedbacks & Boundaries (HL)
Ice-albedo & permafrost positive loops, 350 ppm boundary, Paris Agreement
Guiding Questions
- To what extent has climate change occurred due to anthropogenic causes?
- How do differing perspectives play a role in responding to climate change challenges?
Time allocation: minimum 3 hours SL + additional 4 hours HL. Second subtopic in Topic 6: Atmosphere.
6.2.1 & 6.2.2
Climate System & Anthropogenic Acceleration
Key UnderstandingClimate represents 30+ year average weather patterns. Anthropogenic CO₂ emissions have accelerated rapidly since the post-1950 Great Acceleration.
🌤️ Weather vs. Climate
Weather = day-to-day atmospheric conditions. Climate = 30-year statistical average of temperature, precipitation, and wind.
📈 Post-1950 Acceleration
Pre-industrial CO₂ levels remained at ~280 ppm for millennia. Post-WWII industrial expansion drove concentrations to 425+ ppm today.
| Major Anthropogenic Source | Associated Greenhouse Gas | Global Percentage Share |
|---|
| Fossil Fuel Energy & Transport | Carbon Dioxide (CO₂) & Methane ($\text{CH}_4$) | ~75% of global emissions |
| Deforestation & Land Use Shift | Carbon Dioxide (CO₂) | ~10% of global emissions |
| Agriculture & Livestock | Methane ($\text{CH}_4$) & Nitrous Oxide ($\text{N}_2\text{O}$) | ~15% of global emissions |
6.2.3
Proxy Data & 800,000-Year Climate Record
Key UnderstandingProxy data (ice cores, tree rings, sediment cores) show a direct positive correlation between atmospheric CO₂ concentrations and global temperatures.
| Proxy Data Source | Measurement Mechanism | Information Provided |
|---|
| Ice Cores (Vostok / EPICA) | Air bubbles trapped in ancient ice sheets (oxygen isotopes & gas ratios) | 800,000-year continuous record of CO₂, $\text{CH}_4$, and paleotemperature |
| Tree Rings (Dendrochronology) | Annual growth ring width and wood density | Centennial-scale records of regional moisture and temperature anomalies |
| Ocean Sediment Cores | Foraminifera micro-fossil shell chemistry ($\delta^{18}\text{O}$) | Millennial-scale records of ocean temperature and ice volume |
6.2.4 & 6.2.5
Enhanced Greenhouse Effect & Ecosystem Shifts
Key UnderstandingExcess GHGs enhance radiative heat trapping, resulting in global warming, ocean thermal expansion, coral bleaching, and poleward biome shifts.
🪸 Marine Ecosystem Collapse
Warming sea surface temperatures cause corals to expel zooxanthellae (bleaching). Combined with ocean acidification ($\text{CO}_2 \rightarrow$ carbonic acid), reef structures dissolve.
🌲 Poleward Biome Shifts
Species ranges shift toward higher latitudes and altitudes. Mountain species face "summit traps" with nowhere higher to migrate.
6.2.6
Societal Impacts & Human Vulnerability
Key UnderstandingClimate change threatens human societies through water stress, agricultural loss, vector-borne disease expansion, extreme weather damage, and climate displacement.
| Societal Sector | Climate Vulnerability & Risk |
|---|
| Water Security | Glacial retreat (Himalayas, Andes) depletes river water for billions; saltwater intrusion corrupts coastal aquifers |
| Food Security | Heat stress and shifting rainfall reduce staple grain yields (wheat, maize); extreme droughts trigger crop failures |
| Public Health | Expanding geographic range for malaria/dengue mosquitoes; severe mortality from urban heatwaves |
| Human Migration | Rising sea levels threaten low-lying island nations (Tuvalu, Maldives) generating climate refugees |
6.2.7
Climate Feedback Loops
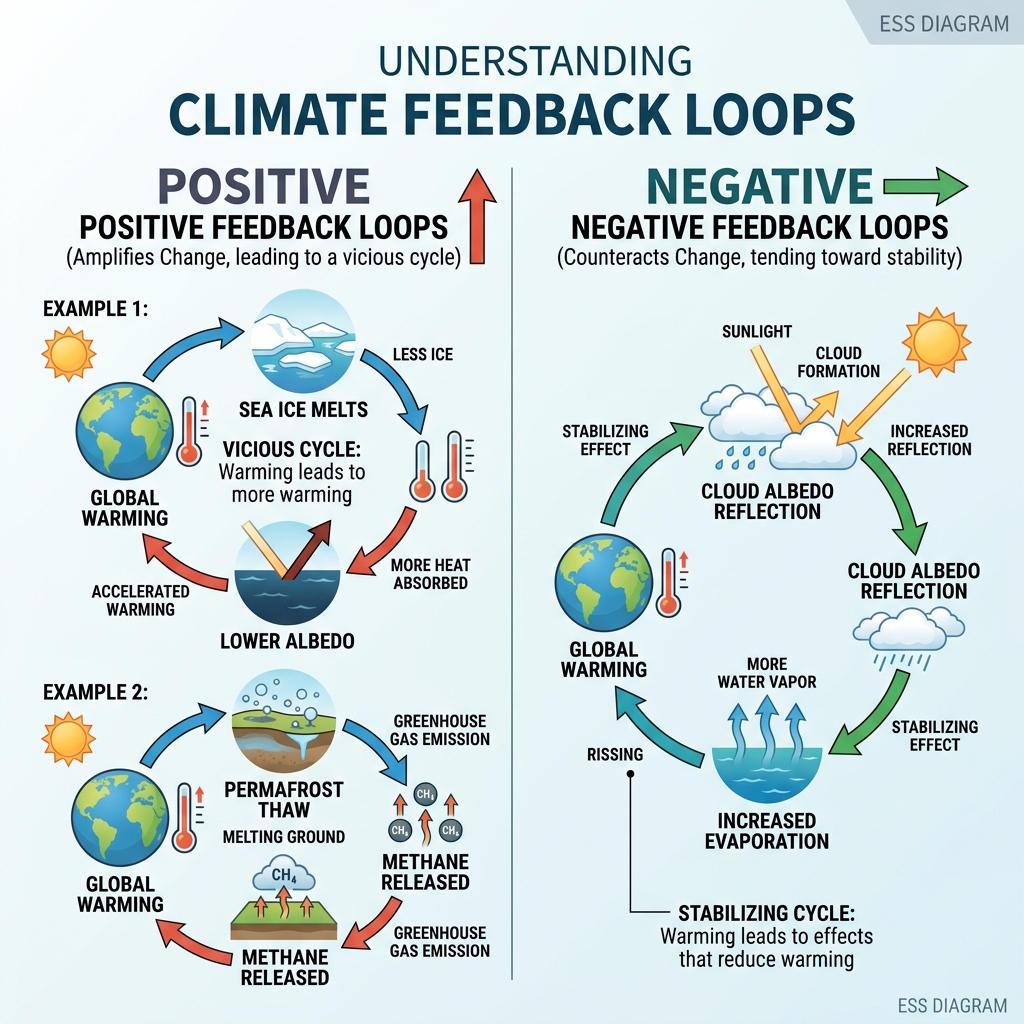
Key UnderstandingClimate systems feature positive feedbacks (amplifying warming) and negative feedbacks (dampening warming). Positive feedbacks dominate today.
🔥 Positive Feedback (Self-Reinforcing)
Ice-Albedo: Warming $\rightarrow$ Ice melts $\rightarrow$ Dark ocean absorbs heat $\rightarrow$ More melting.
Permafrost: Warming $\rightarrow$ Thaw $\rightarrow$ Methane released $\rightarrow$ More warming.
☁️ Negative Feedback (Stabilizing)
Cloud Albedo: Warming $\rightarrow$ Evaporation $\rightarrow$ High low-level cloud cover $\rightarrow$ Reflects solar radiation $\rightarrow$ Cooling effect.
HL — 6.2.8
Climate Change Planetary BoundaryHL
Key UnderstandingThe safe operating limit for climate change is 350 ppm CO₂ and +1.0 W/m² radiative forcing. Both boundaries have been crossed.
| Indicator Parameter | Planetary Safe Boundary | Current Observed Status | Risk Threshold |
|---|
| Atmospheric CO₂ | 350 ppm | 425+ ppm | EXCEEDED (High Risk Zone) |
| Radiative Forcing | +1.0 W/m² | +2.3 W/m² | EXCEEDED (High Risk Zone) |
| Global Temp Anomaly | +1.5°C above pre-industrial | +1.1°C to +1.2°C | Approaching Tipping Points |
Paris Agreement Targets (2015)
Legally binding international treaty committing nations to limit global warming to well below 2.0°C, pursuing efforts to limit increase to 1.5°C above pre-industrial levels to prevent catastrophic climate tipping points.
HL — 6.2.9
Geopolitical Perspectives on Climate ActionHL
Key UnderstandingPerspectives on climate mitigation and adaptation differ based on economic interests, historical emission responsibilities, vulnerability, and political worldviews.
| Stakeholder Perspective | Core Position & Arguments |
|---|
| Developed MEDCs | High historical emissions responsibility; capacity for tech innovation; face economic pushback from fossil fuel industries |
| Developing LEDCs & SIDS | Low historical emissions but highest vulnerability; demand Climate Justice & Loss and Damage funding from wealthy nations |
| Indigenous Communities | Traditional Ecological Knowledge (TEK) stewardship; direct subsistence dependence on shifting climate systems |
Key Terms Glossary
Essential Vocabulary
| Term | Definition |
|---|
| Climate | Statistical average of weather conditions over a minimum 30-year period |
| Proxy Data | Indirect historical climate evidence preserved in ice cores, tree rings, and sediment layers |
| Enhanced Greenhouse Effect | Additional heat trapping caused by anthropogenic GHG emissions ($\text{CO}_2, \text{CH}_4, \text{N}_2\text{O}$) |
| Ice-Albedo Feedback | Positive feedback where melting darkens surfaces, increasing heat absorption and further melting |
| Radiative Forcing | Imbalance between incoming solar radiation and outgoing infrared radiation ($\text{W/m}^2$) |
| Climate Tipping Point | Critical threshold beyond which a climate subsystem undergoes rapid, irreversible transformation |
| Climate Justice | Principle that burden of climate action should reflect historical emissions and socioeconomic vulnerability |
Exam Preparation
Key Takeaways & Exam Tips
Must-Know Concepts
- Proxy Data Evidence: Vostok ice cores prove CO₂ and global temperature move in lockstep; current 425+ ppm is unprecedented in 800,000 years.
- Positive vs Negative Feedback: Ice-albedo and permafrost methane release are positive (amplifying); cloud reflection is negative (cooling).
- HL Planetary Boundary: CO₂ boundary (350 ppm) has been exceeded; Paris Agreement targets +1.5°C limit.
You've covered all 9 syllabus points ✅
6.2.1 – 6.2.7 (SL) + 6.2.8 – 6.2.9 (HL) · Complete Topic 6: Atmosphere!