7.3 Solid Waste · New Syllabus (First Assessment 2026) Standard Level Only
8
Syllabus Points
SL
Level Only
2h
Min. Time
Overview
What You Need to Know
This subtopic examines how societies produce, classify and manage solid domestic waste. Students explore the sources and composition of waste, the environmental and social impacts of waste management, and the most sustainable strategies for waste reduction.
Guiding Questions
How can societies sustainably manage waste?
What are the most effective strategies for minimizing the environmental impact of solid waste disposal?
How can technological innovations and policies be integrated to enhance the efficiency and sustainability of waste management systems?
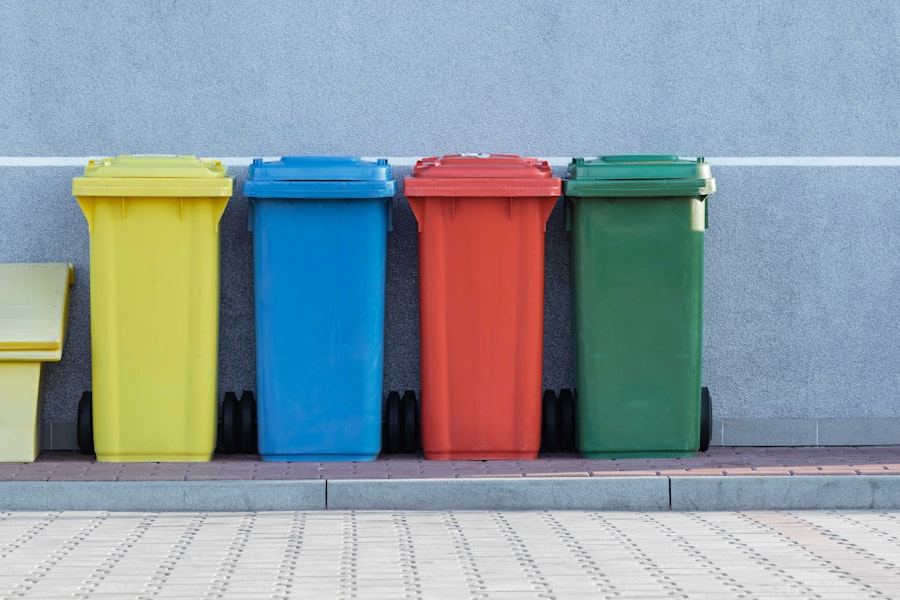
Waste sorting — the first step in sustainable management
A. Sources of Solid Waste
Domestic, industrial, agricultural; classification by source and type; linear economy
B. Composition & Variation
SDW content; factors affecting volume and composition over time and between societies
C. Impacts of Waste Management
Environmental and social impacts; transboundary movement; pollution thresholds
⏱ Time allocation: minimum 2 hours for this subtopic.
7.3.1 — Sources of Solid Waste
Use of Natural Resources Generates Waste
Key Understanding
Use of natural resources generates waste that can be classified by source or type.
Every stage of production and consumption creates waste. In industrialized countries, waste generation has reached alarming levels — nearly one-third of all food produced globally is wasted (~1.3 billion tonnes annually, FAO). The rapid turnover of electronics has created a surge in e-waste, with millions of tonnes discarded each year.
Natural resources → products → waste: the linear economy chain
Linear Economy
A system where people buy a product, use it, and then throw it away: take → make → dispose. This creates enormous landfill waste and depletes finite resources as new raw materials must constantly be extracted. The opposite — a circular economy — designs products for reuse, repair and recycling to keep materials in use longer.
E-waste — one of the fastest-growing waste streams globally
7.3.2 — SDW Composition
Solid Domestic Waste Has Diverse Content
Key Understanding
Solid domestic waste (SDW) typically has diverse content.
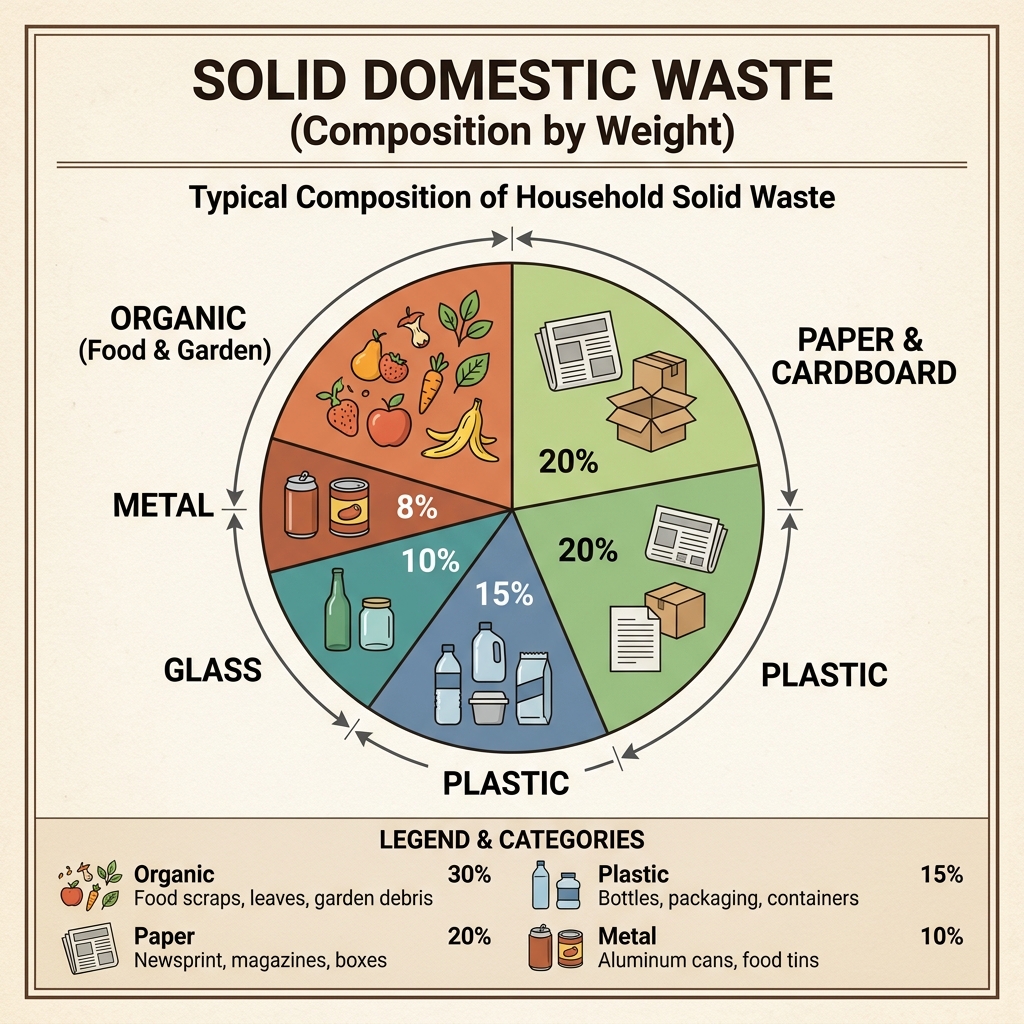
Solid domestic waste (SDW) refers to waste generated from households. It includes a wide variety of materials discarded in daily life. Understanding its composition is crucial for effective waste management.
Bottles, jars. 100% recyclable without quality loss. Recycled glass reduces energy use by 30%.
🥫 Metal
Aluminium and tin cans. Recycling aluminium saves 95% of the energy needed for virgin production.
🧴 Plastics
Packaging, bottles, bags. Major contributor to ocean pollution. Only ~9% of all plastic ever made has been recycled.
🌿 Organic Waste
Food scraps, garden waste. Compostable — creates nutrient-rich soil and reduces methane from landfills.
📦 Other (Textiles, Wood, Rubber)
Clothing, furniture, leather goods. Growing stream due to fast fashion. Often hard to recycle.
📝 Remember For exams: know at least three common materials in SDW and their recycling potential. Organic waste is the largest single component globally (~25%).
7.3.3 — Variation Over Time & Societies
Waste Volume and Composition Varies
Key Understanding
The volume and composition of waste varies over time and between societies due to socioeconomic, political, environmental and technological factors.
Waste generation varies enormously between high-income and low-income countries
Key Data: Global Waste Generation
Country/Region
Daily Waste Per Person
Annual Total
Key Factors
USA
~2.3 kg (4.9 lbs)
~1,159 kg
High consumption, single-use culture
UK
~1.5 kg
~548 kg
Urbanised, high service economy
Sub-Saharan Africa
~0.39 kg
~142 kg
Lower consumption, less formal collection
Global average
~0.74 kg
~270 kg
Wide variation by income level
Source: World Bank, What a Waste 2.0 (2018); US EPA (2018)
Factors Affecting Waste Volume
Socioeconomic: Higher income → more consumption → more waste; industrialized societies produce more packaging waste
Environmental: Climate, geography, and available infrastructure affect disposal methods
Technological: Better packaging technology and electronics shorten product lifecycles → more e-waste
Composition Differences
High-Income Countries
30–40% food wasted at consumer level
High packaging waste (plastics, card)
Growing e-waste from tech turnover
Low-Income Countries
Food waste occurs in production/transport
Less packaging, more organic content
Informal recycling sectors
📊 Case Study — Historical Shift
In pre-industrial societies, waste was minimal and mostly organic — easily absorbed by local ecosystems. Non-biodegradable items were treasured and passed down through generations. The Industrial Revolution brought mass production and mass waste. Today, high-income countries generate roughly 5–7× more waste per capita than low-income countries (World Bank).
7.3.4 — Impacts of Waste Management
Production, Treatment & Management Has Impacts
Key Understanding
The production, treatment and management of waste has environmental and social impacts, which may be experienced in a different location from where the waste was generated.
Waste impacts often travel far from where they were generated — "away" is a myth
The Illusion of "Away"
When we throw something "away," it doesn't disappear. It goes to a landfill, incinerator, ocean, or another country. Waste persists — often with long-lasting environmental and social consequences.
Waste ≠ Gone · Waste = Somewhere else · "There is no 'away'"
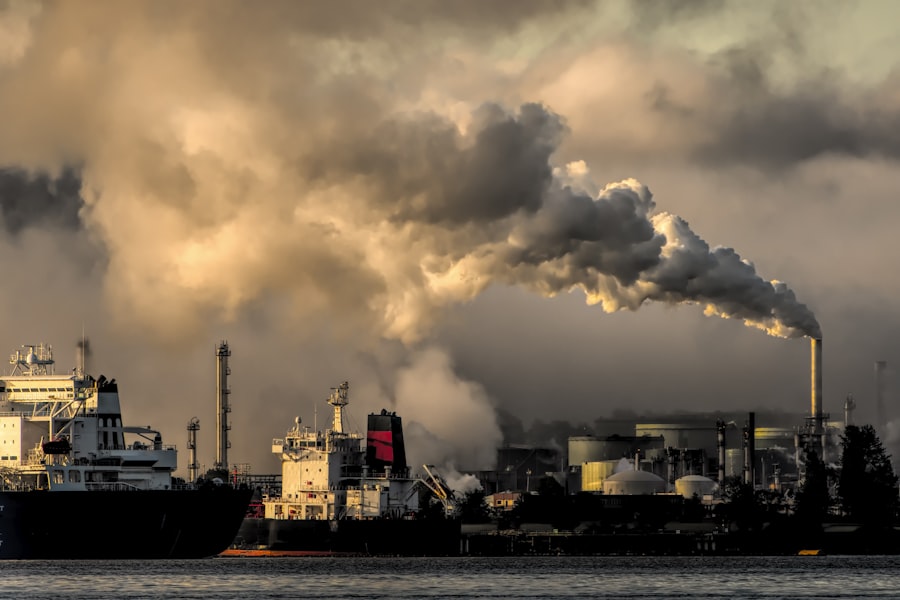
Air pollution (dioxins, particulates); toxic fly ash requiring landfill; greenhouse gas emissions
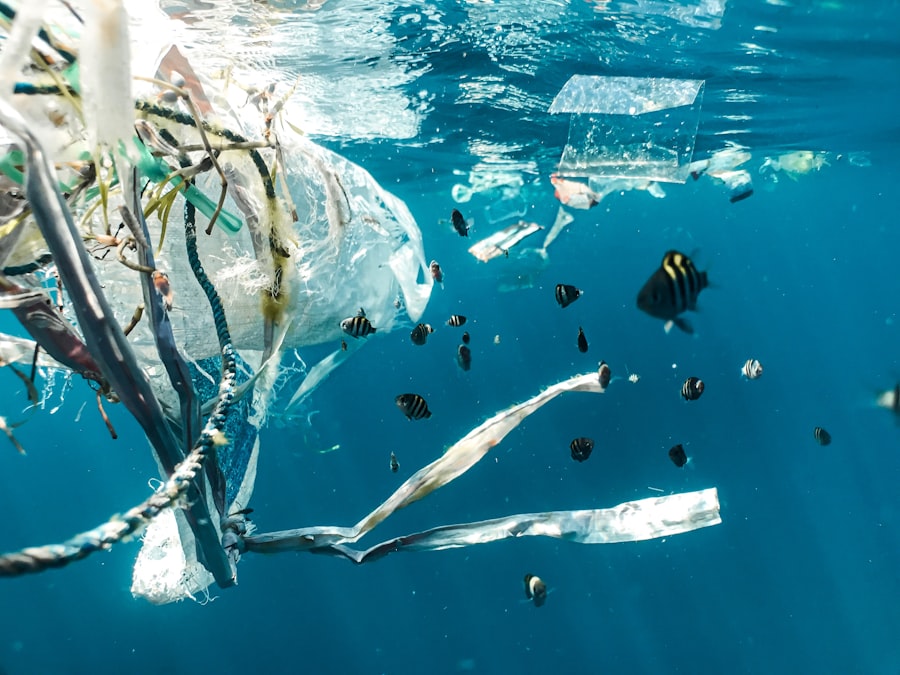
Plastic pollution
Non-biodegradable waste in oceans; marine life ingestion/entanglement; microplastics in food chain
Informal disposal
Open burning releases toxins; uncontrolled dumps spread disease vectors
Social Impacts
Health risks: Poor communities exposed to hazardous waste (e.g. informal e-waste processing in Ghana)
Environmental injustice: Waste exported from HICs to LICs where it is poorly managed
Quality of life: Odour, noise, vermin, and visual pollution from poorly managed waste sites
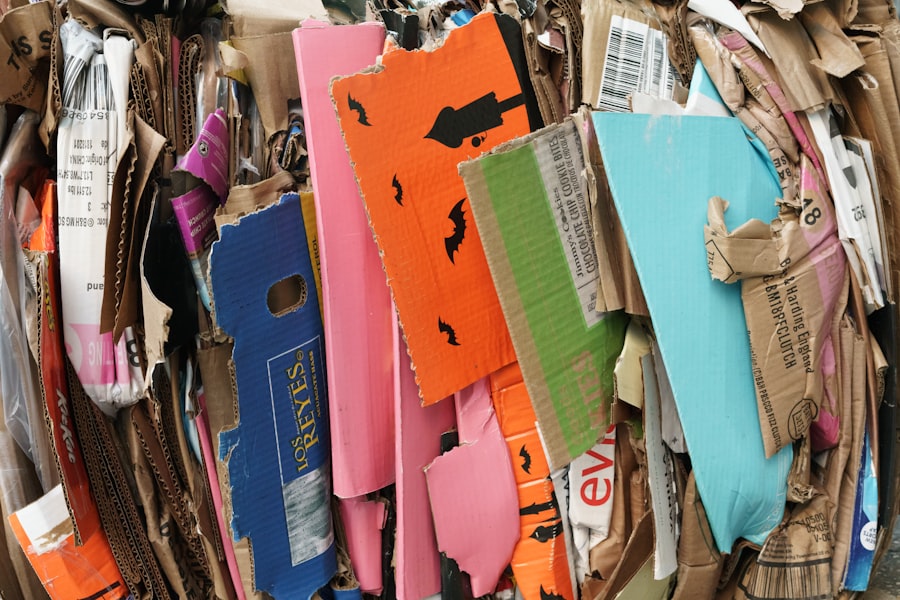
Waste segregation at source — key to reducing downstream impacts
The Global Movement of Waste
⚠ Transboundary Waste
Despite local management efforts, significant amounts of waste are transported across borders — typically from HICs to LICs. This is particularly common with e-waste and plastic waste. Low-income countries often lack infrastructure to manage hazardous waste safely, creating severe environmental degradation and health risks. The Basel Convention regulates this movement but enforcement remains a challenge.
🇩🇪 Case Study — Germany's Waste Segregation
Germany is a global leader in waste management. Households are provided with colour-coded bins: Yellow (plastic/metal packaging), Blue (paper/cardboard), Brown (organic waste), Black/Gray (residual waste). This system has driven recycling rates above 65% — the highest in the EU.
7.3.5 — Pollution Threshold
Ecosystems Absorb Waste — But Only Up to a Point
Key Understanding
Ecosystems can absorb some waste, but pollution occurs when harmful substances are added to an environment at a rate faster than they are transformed into harmless substances.
Healthy ecosystems naturally decompose organic waste — but have limits
Key Concepts
Concept
Definition
Example
Biodegradability
Ability of a substance to be broken down by natural processes (microorganisms)
Food scraps → days/weeks; paper → months; plastic → hundreds of years
Half-life
Time for half of a substance to break down or be eliminated from the environment
DDT: ~15 years; Uranium-238: 4.5 billion years
Pollution threshold
The rate at which waste input exceeds the ecosystem's capacity to process it
Eutrophication from excess nutrients; microplastic accumulation
Non-biodegradable waste accumulates when ecosystems can't break it down
Environmental Impacts When Thresholds Are Exceeded
💧 Water Pollution
Nutrient runoff causes eutrophication → algal blooms → oxygen depletion → aquatic death. Plastics persist and enter food chains.
🌍 Soil Contamination
Heavy metals and pesticides accumulate → reduced soil fertility → disrupted microbial life → biodiversity loss.
💨 Air Pollution
SO₂ and NOₓ from burning waste → acid rain → damages forests, lakes, and buildings over long distances.
🐟 Food Chain Contamination
POPs bioaccumulate through food chains → reach dangerous concentrations in humans → cancer, reproductive disorders.
🤔 Think About It If a factory dumps chemicals into a river faster than the river's bacteria can break them down, at what point does "waste disposal" become "pollution"? What determines that threshold?
📝 Exam Hint When asked about pollution, always link to the concept of the ecosystem's carrying capacity for waste. Pollution = input rate > natural processing rate. This is a quantitative threshold, not just "waste is bad."
7.3.6 — Preventative vs Restorative
Preventative Strategies Are More Sustainable
Key UnderstandingPreventative strategies for waste management are more sustainable than restorative strategies.
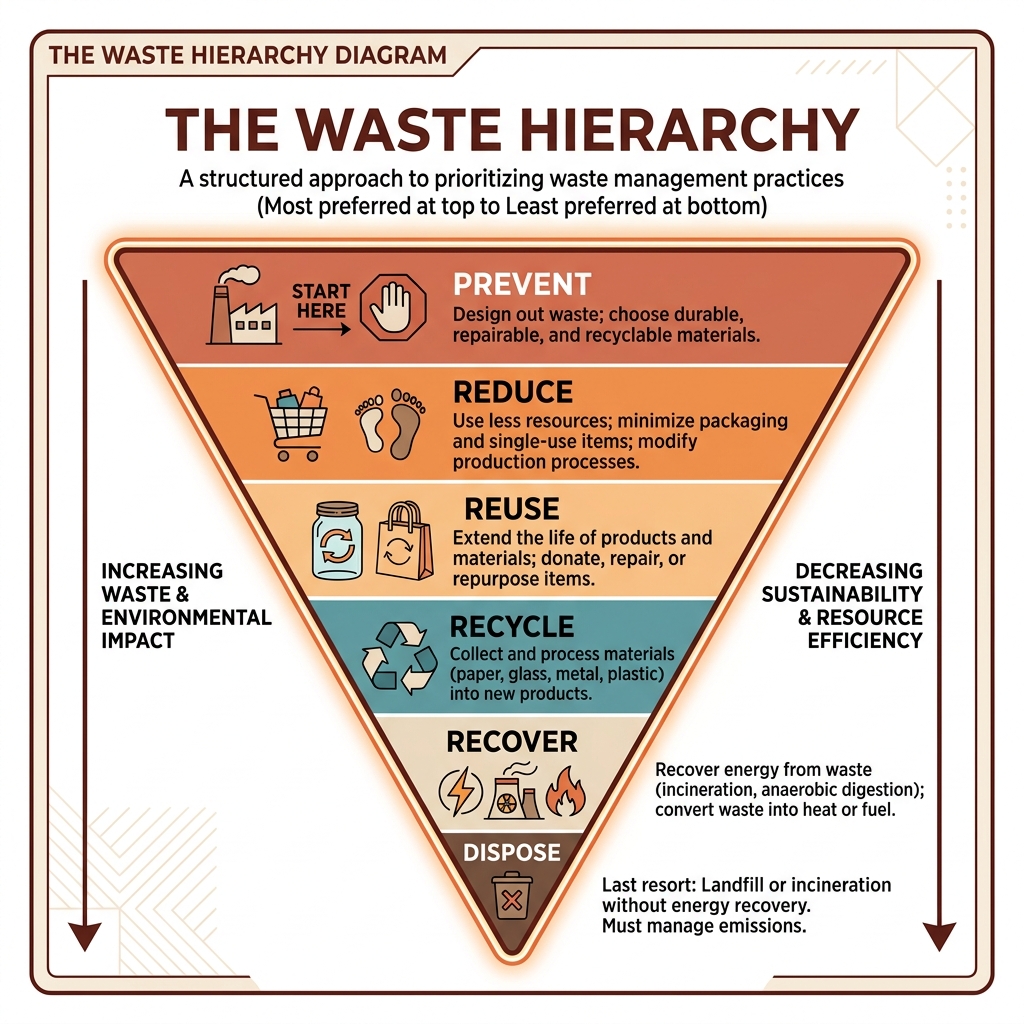
The 3 Rs (Reduce, Reuse, Recycle) are preventative — they prevent waste before it exists
Comparison
✅ Preventative Strategies
Address waste at the source
Reduce consumption and packaging
Extended Producer Responsibility (EPR)
Bans on single-use plastics
Public education campaigns
More sustainable — lower cost, lower impact
🔄 Restorative Strategies
Clean up after damage occurs
Ocean cleanup projects
Brownfield remediation
Contaminated water treatment
Costly and often incomplete
Less sustainable — addresses symptoms, not causes
Prevention > Cure · Stopping waste before it's created > Cleaning it up after
Circular economy is the overarching framework for preventative strategies. Instead of the linear take-make-dispose model, a circular economy designs products for durability, repair, reuse, and recycling — keeping materials in use for as long as possible and minimising waste at every stage. This is the systemic shift behind EPR policies, product redesign, and the "6 Rs" (Refuse, Rethink, Repurpose, Repair, Remanufacture, Recover).
🌍 Case Study — Single-Use Plastic Bans
Over 120 countries have introduced bans or taxes on single-use plastics. Rwanda banned plastic bags in 2008 — now one of the cleanest nations in Africa. The EU banned single-use plastics (cutlery, plates, straws, stirrers) in 2021. These preventative measures reduce waste at source, avoiding the far higher cost of ocean cleanup or landfill management.
🤔 Think About It Is recycling truly "preventative" — or is it a restorative strategy that happens before the damage is severe? Where does "reduce" end and "recycle" begin on the prevention spectrum?
7.3.7 — Disposal Options
Different Disposal Options, Different Trade-Offs
Key Understanding
Different waste disposal options have different advantages and disadvantages in terms of their impact on societies and ecosystems.
Landfill — still the world's most common waste disposal method
Landfill
Advantages
Cheap and simple to operate
Methane capture for energy production
Creates local jobs
Old sites can be landscaped and reused
Disadvantages
Methane emissions (greenhouse gas)
Leachate contaminates groundwater
Landfill sites filling up globally
Odour, vermin, visual pollution
Incineration reduces waste volume by 80–85% but creates air quality concerns
Incineration
Advantages
Reduces waste volume by 80–85%
Can generate electricity (waste-to-energy)
Destroys hazardous/clinical waste
Avoids methane emissions of landfills
Disadvantages
Air pollution (dioxins, heavy metals)
Toxic fly ash requires landfill
Very high setup costs
Public opposition (NIMBY)
Recycling saves raw materials and energy — but depends on public participation
Recycling
Advantages
Conserves raw materials and energy
Reduces pollution at extraction stage
Creates green jobs
Lowers greenhouse gas emissions
Disadvantages
Requires public buy-in and sorting
Not always cost-effective
High initial capital investment
Recycled products may be less durable
Composting
Advantages
Low cost; can be done at household level
Creates nutrient-rich soil
Reduces landfill organic waste
Decreases need for synthetic fertilisers
Disadvantages
Attracts pests if poorly managed
Only works for organic matter
Requires space and public buy-in
Odour problems at scale
🤔 Your Turn You're the waste minister for a small island nation with limited land, no recycling infrastructure, and growing tourism. Which disposal method do you prioritise first — and why? What would need to change before you could adopt the others?
📝 Exam Hint For "discuss" questions on disposal methods: always evaluate both sides with specific data. E.g. "Incineration reduces volume by 85%, but emits dioxins — a carcinogen. Cost-benefit depends on whether the country has land scarcity (Japan favours incineration) or open land (US favours landfills)."
7.3.8 — Sustainable Management
Promoting Sustainable Waste Management
Key Understanding
Sustainable options for management of SDW can be promoted in societies.
Sustainable waste management requires infrastructure, policy, and cultural change
Strategies for Promotion
Strategy
How It Works
Named Example
Taxes & Financial Incentives
Charge for waste disposal to discourage excess; subsidise recycling
Pay-As-You-Throw (PAYT) — shown to reduce waste volumes significantly where implemented
South Korea's food waste recycling scheme (~95% recycled)
Community Initiatives
Community composting; zero-waste groups; local repair cafés
Kamikatsu, Japan — 45-category sorting
Pay-As-You-Throw (PAYT)
More waste = Higher cost
→
Behaviour change
→
Less waste + More recycling
PAYT creates a direct financial incentive to reduce waste. Where implemented, waste volumes typically decrease by 25–45%. South Korea's volume-based waste fee system, introduced in 1995, reduced per capita waste by over 15% within a decade and boosted recycling rates from 15% to over 60%.
Successful recycling depends on accessible infrastructure and public participation
🇯🇵 Case Study — Kamikatsu Zero Waste
Kamikatsu, a town of ~1,500 people in Japan, declared zero waste by 2020. Residents sort waste into 45 categories. The town operates a "kuru-kuru" shop where items are exchanged for reuse. While the 2020 target wasn't fully met, the town achieves ~80% recycling/composting rate — compared to ~20% national average.
🇸🇪 Case Study — Sweden
Sweden recycles or composts ~49% of waste and incinerates ~49% for energy. Less than 1% goes to landfill. The country actually imports waste from other European nations to fuel its waste-to-energy plants, which provide heating for 250,000 homes.
🤔 Think About It Sweden imports other countries' waste for energy. Is that sustainable — or just shifting the problem? What happens when neighbouring countries improve their own recycling?
📝 Exam Hint For "evaluate" questions: compare preventative (PAYT, bans, education) vs restorative (ocean cleanup, landfill remediation) approaches. Strong answers note that prevention is more sustainable but requires political will and cultural change, while restoration addresses existing damage but doesn't prevent future waste.
Key Terms
Glossary — Essential Vocabulary
Term
Definition
Solid domestic waste (SDW)
Waste generated from households, including packaging, food scraps, appliances, and furniture
Linear economy
Take-make-dispose system where resources are extracted, used, and discarded
Circular economy
System designed to keep resources in use for as long as possible through reuse, repair, and recycling (see 7.3.6)
Biodegradability
Ability of a substance to be broken down naturally by microorganisms
Half-life
Time required for half of a substance to break down or be eliminated from the environment
Bioaccumulation
Gradual build-up of substances in an organism over time, especially through the food chain
Leachate
Liquid that drains or 'leaches' from a landfill, carrying dissolved contaminants
Methane
Greenhouse gas produced by organic waste decomposition in landfills; 25× more warming potential than CO₂
E-waste
Discarded electronic devices and components (computers, phones, TVs)
Transboundary waste
Waste transported across national borders for disposal or recycling
Basel Convention
International treaty regulating movement of hazardous waste between countries
Extended Producer Responsibility (EPR)
Policy requiring manufacturers to manage the end-of-life disposal of their products
Pay-As-You-Throw (PAYT)
Waste management scheme where households are charged based on the amount of waste they produce
Preventative strategy
Waste management approach that reduces or eliminates waste before it is created
Restorative strategy
Waste management approach that cleans up and restores environments after damage has occurred
Waste-to-energy
Burning waste at high temperatures to generate electricity or heat
Exam Preparation
Key Takeaways & Exam Tips
📝 Paper 1 — Case Study Skills
Identify the waste composition of the case study country — what % is organic, plastic, paper?
Link to income level — HICs generate more packaging waste; LICs have more organic waste
Evaluate disposal methods used — are they preventative or restorative?
Consider transboundary impacts — does the country export waste? Import waste?
📝 Paper 2 — Structured Essay Tips
Define key terms — "SDW refers to waste generated from households, including…"
Use specific data — "The average American produces 2.3 kg of waste per day, compared to 0.39 kg in sub-Saharan Africa (World Bank, 2018)"
Compare and contrast — preventative vs restorative, HIC vs LIC, landfill vs incineration
Evaluate with perspectives — ecocentric (reduce consumption) vs technocentric (waste-to-energy)