Subtopic 8.1 · New Syllabus (First Assessment 2026) Standard Level + Higher Level
8
SL Syllabus Points
2
HL Extensions
10
Total Understandings
Overview
What You Need to Know
This subtopic examines how human populations grow, change and are measured. Students explore birth and death rates, population models, policy interventions, age–sex pyramids, and the demographic transition model.
Guiding Questions
How can the dynamics of human populations be measured and compared?
To what extent can the future growth of the human population be accurately predicted?
A. Population Inputs & Outputs
Births, deaths, immigration, emigration; CBR, CDR, TFR, NIR, doubling time
B. Growth Models & Policies
Population growth curves; UN projections; anti-natalist, pro-natalist, and indirect management
C. Demographic Analysis
Age–sex pyramids; DTM; dependency ratio; population momentum
D. HL Extensions
Population stress on Earth's systems; dependency ratio & momentum deep-dive
⏱ Time allocation: minimum 2 hours for this subtopic.
8.1.1 — Population Inputs
Births & Immigration Are Inputs
Key UnderstandingBirths and immigration are inputs to a human population.
Human populations can be modelled as a stock (storage) that changes over time through inputs (births, immigration) and outputs (deaths, emigration). This systems approach helps us understand why populations grow or shrink.
Key Measures
Measure
Definition
Formula
Crude Birth Rate (CBR)
Live births per 1,000 people per year
(Births ÷ Total Population) × 1,000
Total Fertility Rate (TFR)
Average births per woman of childbearing age (15–49)
Sum of age-specific birth rates
General Fertility Rate (GFR)
Births per 1,000 women aged 15–49
(Births ÷ Women 15–49) × 1,000
Example: Country X has 250,000 births and a population of 10,000,000
CBR = (250,000 ÷ 10,000,000) × 1,000 = 25 per 1,000
Why CBR Varies Between Countries
Fertility rates: Cultural norms, access to family planning, desired family size
Age structure: Younger populations have more women of childbearing age
Socioeconomic factors: Education, employment, urbanisation all influence birth rates
Healthcare: Access to contraception directly affects fertility
📊 ExampleNiger has a CBR of ~47 per 1,000 (high fertility, young population). Japan has a CBR of ~7 per 1,000 (low fertility, aging population). The difference is driven by education, healthcare access, cultural norms, and economic development.
8.1.2 — Population Outputs
Deaths & Emigration Are Outputs
Key UnderstandingDeaths and emigration are outputs from a human population.
Key Measures
Measure
Definition
Formula
Crude Death Rate (CDR)
Deaths per 1,000 people per year
(Deaths ÷ Total Population) × 1,000
Infant Mortality Rate (IMR)
Deaths of children under 1 per 1,000 live births
(Deaths under 1 ÷ Live Births) × 1,000
Life Expectancy
Average years a newborn is expected to live
Calculated from current mortality rates
Example: Country Y has 80,000 deaths and a population of 5,000,000
CDR = (80,000 ÷ 5,000,000) × 1,000 = 16 per 1,000
⚠ CDR PitfallCDR is a poor standalone indicator. Countries with many elderly people (e.g. Denmark, CDR ~11) appear to have higher death rates than countries with young populations (e.g. Mexico, CDR ~5) — even though Denmark has far better healthcare. Always consider age structure when interpreting CDR.
Why CDR Varies Between Countries
Healthcare quality: Access to medicines, hospitals, vaccinations
Disease burden: Malaria, HIV/AIDS, tuberculosis in LICs
Age distribution: Older populations have naturally higher CDRs
Living conditions: Nutrition, sanitation, clean water access
Conflict & disasters: Wars and natural disasters spike death rates
Emigration
People leave countries due to economic hardship, political instability, environmental degradation, or conflict. High emigration rates can indicate push factors (war, poverty) or pull factors (jobs, safety elsewhere).
8.1.3 — Quantifying Dynamics
Key Population Calculations
Key UnderstandingPopulation dynamics can be quantified and analysed by calculating total fertility rate, life expectancy, doubling time and natural increase.
Four Essential Calculations
Metric
Definition
Formula
Total Fertility Rate (TFR)
Average births per woman (15–49)
Sum of age-specific birth rates
Natural Increase Rate (NIR)
Population growth from births minus deaths (excludes migration)
Years for population to double at current growth rate
DT = 70 ÷ Growth Rate (%)
Life Expectancy
Average years a newborn is expected to live
Calculated from current mortality data
Replacement Level TFR ≈ 2.1 — the rate at which a population replaces itself without migration
Worked Example:
CBR = 25 per 1,000 · CDR = 10 per 1,000
NIR = 25 − 10 = 15 per 1,000 = 1.5% per year Doubling Time = 70 ÷ 1.5 = ~47 years
→ This population doubles in roughly 47 years at current rates.
Why These Metrics Vary
High TFR Countries
Limited education for women
High infant mortality (need replacements)
Agricultural economies (children = labour)
Weak family planning access
Low TFR Countries
High education levels
Low infant mortality
Urban economies (children = cost)
Universal family planning access
📝 Exam Hint Exam questions often ask you to calculate NIR and doubling time from given data. Practice: NIR% = (CBR − CDR) ÷ 10, DT = 70 ÷ Growth Rate%. Always show your working.
8.1.4 — Population Growth Curve
The Global Population Explosion
Key UnderstandingThe global human population has followed a rapid growth curve. Models are used to predict the growth of the future global human population.
8 billion people and counting — the growth curve keeps climbing
Historical Growth
For thousands of years: ~0.04% annual growth (stable)
~1800 (Industrial Revolution): growth rate began climbing
Current growth rate: ~0.8–1% per year (slowing but still adding ~70M people/year)
UN Projection Models
Because future fertility rates are uncertain, the UN uses three scenarios:
Scenario
Assumption
2100 Projection
Implications
High
Fertility stays high or declines slowly
~15+ billion
Severe resource pressure, food insecurity, climate stress
Medium (most likely)
Fertility declines at current trend
~10.4 billion
Manageable with policy intervention
Low
Fertility drops below replacement level widely
~7 billion
Aging populations, labour shortages, economic stagnation
📊 Case Study — India vs NigeriaIndia overtook China as the world's most populous country in 2023 (~1.44B). Nigeria is projected to become the 3rd most populous by 2050 (~375M → ~546M). The difference: India's TFR has dropped to ~2.0 (below replacement), while Nigeria's remains ~5.1.
🤔 Think About It If the medium scenario plays out, the global population peaks at ~10.4 billion around 2080 and then slowly declines. What does this mean for food systems, climate policy, and economic growth?
8.1.5 — Population Policies
Direct Population Management
Key UnderstandingPopulation and migration policies can be employed to directly manage growth rates of human populations.
Anti-Natalist Policies (Reduce Births)
Tool
Mechanism
Example
Legal restrictions
Limits on children per family
China's One-Child Policy (1979–2015)
Economic disincentives
Higher taxes, reduced benefits for large families
Singapore's baby bonus (reduced for 3rd+ child)
Contraception access
Free/subsidised family planning
Iran's family planning programme (1989)
Education campaigns
Promoting smaller families
India's "Hum Do Hamare Do" (We Two, Our Two)
🇨🇳 Case Study — China's One-Child PolicyIntroduced 1979, relaxed to two-child in 2016, three-child in 2021. Successfully slowed growth (~400M births prevented by some estimates) but created side effects: aging population, gender imbalance (117 boys per 100 girls), shrinking workforce, and "4-2-1 problem" (one child supporting two parents and four grandparents).
Pro-Natalist Policies (Increase Births)
Tool
Mechanism
Example
Financial incentives
Child benefits, tax breaks, baby bonuses
France's family allocations
Parental leave
Paid maternity/paternity leave
Sweden's 480 days shared leave
Childcare support
Subsidised or free childcare
Nordic countries
Housing benefits
Priority/larger housing for families
Russia's "maternity capital" programme
🇫🇷 Case Study — FranceFrance has one of the highest TFR in Europe (~1.8) thanks to comprehensive pro-natalist policies: generous parental leave, family allowances, tax benefits for 3+ children, and subsidised childcare. These policies have been in place since the post-WWII era.
⚠ Migration PoliciesPoints-based immigration systems (e.g. Australia, Canada) are another direct management tool — attracting skilled workers to fill labour gaps and manage population size without affecting birth rates.
8.1.6 — Indirect Management
Indirect Population Management
Key UnderstandingHuman population growth can also be managed indirectly through economic, social, health, development and other policies that have an impact on births, deaths or migration.
Indirect management doesn't target population directly — it changes the conditions that influence reproductive choices.
Key Indirect Levers
Policy Area
Mechanism
Effect on Population
Named Example
Female education
Delays marriage, increases career options, improves family planning
TFR falls significantly
Bangladesh: girls' education reduced TFR from 6.9 → 2.0 (1970–2020)
Economic development
Reduces need for child labour, increases cost of raising children
TFR falls as economies grow
South Korea: rapid industrialisation drove TFR from 6.0 → 0.8
🇧🇩 Case Study — BangladeshSince the 1990s, Bangladesh invested heavily in female education: free compulsory schooling for girls, financial incentives for families to keep daughters in school. Result: TFR dropped from 6.9 (1970) to 2.0 (2020) — without any coercive anti-natalist policy. Educated women delay marriage, have fewer children, and invest more in each child's health and education.
🤔 Think About It Which is more effective — direct policies (like China's one-child rule) or indirect policies (like Bangladesh's education investment)? What are the ethical trade-offs?
8.1.7 — Age–Sex Pyramids
Modelling Population Composition
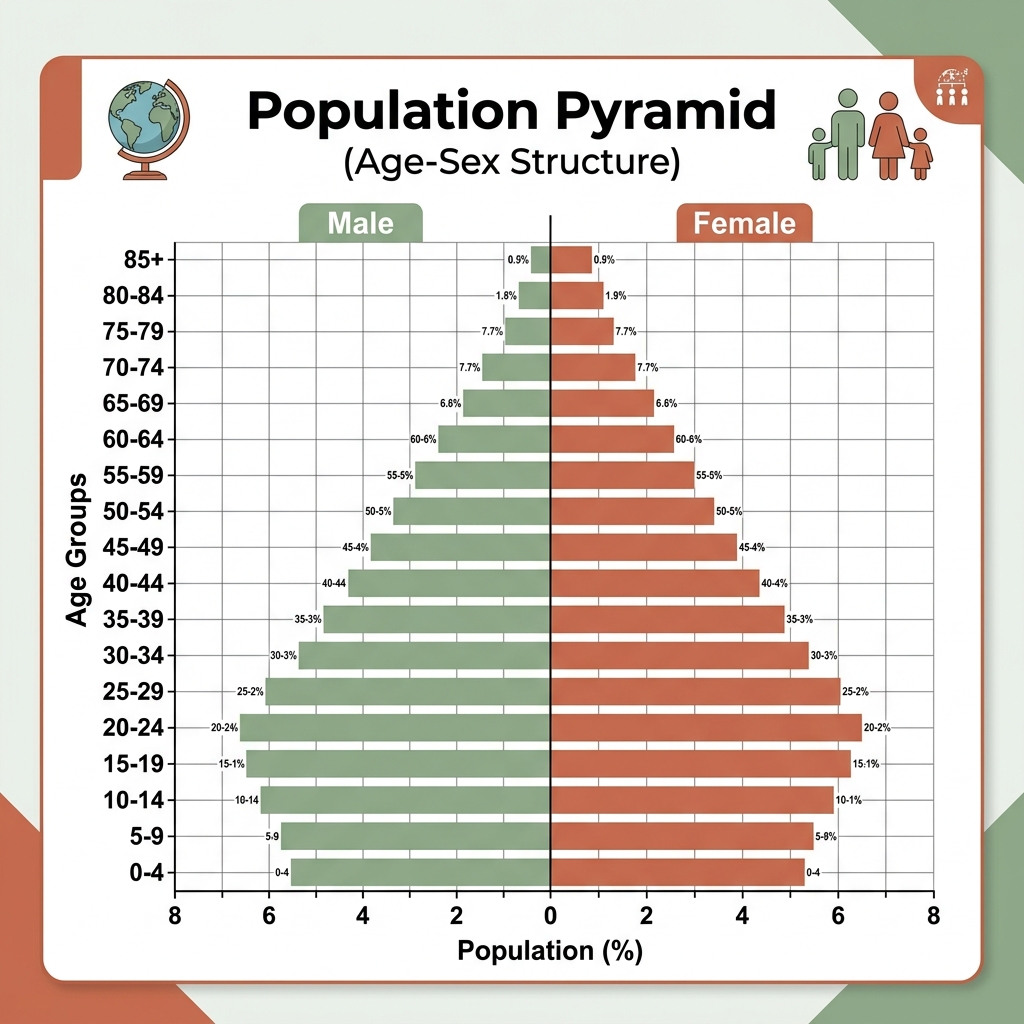
Key UnderstandingThe composition of human populations can be modelled and compared using age–sex pyramids.
How to Read an Age–Sex Pyramid
Shape Feature
What It Tells You
Wide base
High birth rate — youthful, growing population
Narrowing base
Falling birth rate — growth slowing
Vertical sides
Low death rate — most people surviving to old age
Concave slopes
High death rate — rapid attrition in each age group
Bulge in middle
Immigration or in-migration of working-age people
Deficit (dent)
Emigration, war, or epidemic affecting specific ages
Three Classic Shapes
🔴 Expanding (Nigeria)
Broad base, narrow top. High birth rate, high death rate. Rapid growth. Challenges: education, employment for youth bulge.
🇳🇬 vs 🇯🇵Nigeria: ~43% of population under 15. TFR ~5.1. Massive youth bulge — needs schools, jobs, infrastructure. Japan: ~12% under 15, ~29% over 65. TFR ~1.2. Shrinking workforce — relies on automation and immigration to fill gaps.
📝 Exam Hint When given an age–sex pyramid, identify: (1) shape type, (2) birth rate trend (base width), (3) death rate trend (side slope), (4) migration effects (bulges/dents), (5) economic challenges ahead.
8.1.8 — Demographic Transition Model
The DTM: From High to Low Growth
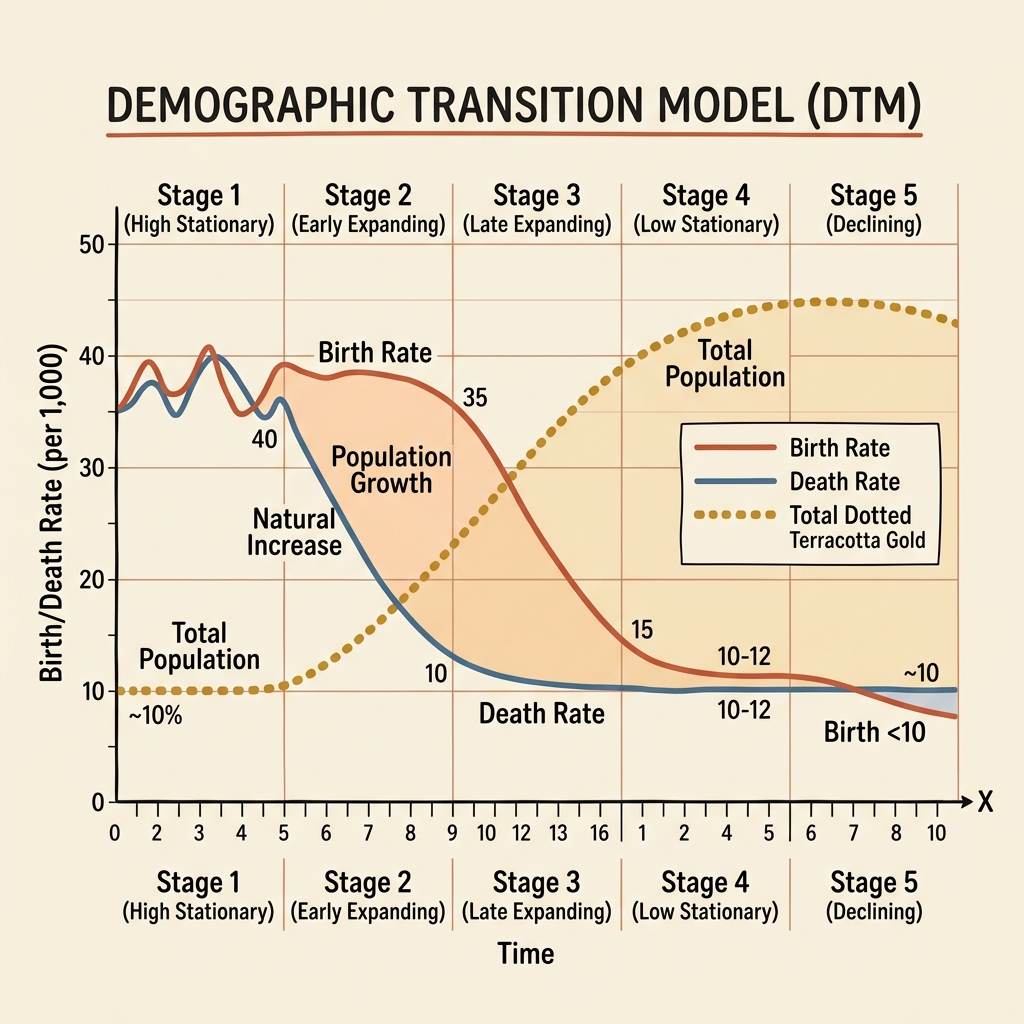
Key UnderstandingThe demographic transition model (DTM) describes the changing levels of births and deaths in a human population through different stages of development over time.
The Four Stages
Stage
CBR
CDR
NIR
Population Trend
Typical Context
1 — High Stationary
High
High
Low
Stable, low total
Pre-industrial societies
2 — Early Expanding
High
Falling
High
Rapid growth
Industrialising / developing
3 — Late Expanding
Falling
Low
Declining
Growth slowing
Industrialised / urbanised
4 — Low Stationary
Low
Low
Low
Stable or declining
Post-industrial / MEDC
Some models add a Stage 5 (declining) where CDR exceeds CBR — e.g. Japan, Germany, Italy.
What Drives the Transition?
Stage 1→2: Healthcare improves (vaccines, sanitation) → death rates fall while birth rates stay high
Stage 2→3: Education, urbanisation, women's rights → birth rates begin falling
Stage 3→4: Universal family planning, high living costs, career priorities → birth rates reach replacement level
🌍 Country Examples on the DTMStage 2: Chad, Niger, Mali (high CBR, falling CDR, rapid growth) Stage 3: India, Brazil, South Africa (CBR falling, growth slowing) Stage 4: USA, UK, Australia (low CBR, low CDR, stable) Stage 5: Japan, Germany, Italy (CBR below CDR, population declining)
🤔 Think About It The DTM assumes all countries follow the same path. But some oil-rich Gulf states (high income, high fertility) don't fit neatly. What are the model's limitations?
8.1.9 — HL Extension
Population Stress on Earth's Systems HL
Key Understanding (HL)Rapid human population growth has increased stress on the Earth's systems.
More people = more demand on finite planetary resources
Stress Areas
Earth System
Population Pressure
Consequence
Biosphere
Habitat conversion for agriculture/urbanisation
Biodiversity loss, species extinction
Climate
More energy, transport, agriculture = more GHGs
Global warming, extreme weather
Hydrosphere
Water demand exceeds recharge in many regions
Water scarcity, aquifer depletion
Geosphere
Mining, quarrying, soil degradation
Soil erosion, desertification
The Doughnut Economics Model (Kate Raworth)
A framework for balancing human needs with planetary limits:
🎯 Social Foundation (inner ring)
Minimum needs for a decent life: food, water, healthcare, education, energy, income, political voice. Falling below = human deprivation.
The goal: live within the doughnut — above the social foundation, below the ecological ceiling
⚠ Biocapacity DisparityHigh-income countries consume far more than their fair share of biocapacity. If everyone lived like the average American, we'd need ~5 Earths. The population-environment relationship is not just about how many people, but how much each person consumes.
8.1.10 — HL Extension
Dependency Ratio & Population Momentum HL
Key Understanding (HL)Age–sex pyramids can be used to determine the dependency ratio and population momentum.
Example: Country with 30M children, 10M elderly, 60M working-age
DR = (30 + 10) ÷ 60 × 100 = 66.7 — every 100 workers support ~67 dependents
Dependency Type
Population Structure
Economic Challenge
Youth dependency
Broad base — many children (0–14)
Schools, childcare, youth employment
Elderly dependency
Wide top — many retirees (65+)
Pensions, healthcare, shrinking workforce
Population Momentum
Even if fertility rates drop to replacement level (TFR ≈ 2.1), populations can continue growing for decades because a large proportion of young people are entering their reproductive years.
Population Momentum = large young cohort → more potential parents → continued growth even at lower TFR
🇮🇳 Case Study — India's MomentumIndia's TFR has dropped to ~2.0 (below replacement), but the population will keep growing for ~30 more years because ~25% of Indians are under 15. These young people will enter reproductive age, sustaining growth even though each woman has fewer children on average.
📝 Exam Hint Population momentum explains why "just stop having babies" doesn't instantly stabilise populations. The age structure itself drives growth for a generation after fertility declines. This is a classic exam concept — always link it to the pyramid shape.
Key Terms
Glossary — Essential Vocabulary
Term
Definition
Crude Birth Rate (CBR)
Number of live births per 1,000 people per year
Crude Death Rate (CDR)
Number of deaths per 1,000 people per year
Total Fertility Rate (TFR)
Average number of births per woman of childbearing age (15–49)
Natural Increase Rate (NIR)
CBR minus CDR — population growth from births and deaths only (excludes migration)
Doubling Time (DT)
Number of years for a population to double, calculated as 70 ÷ growth rate (%)
Replacement Level TFR
TFR of ~2.1 — the rate at which a population replaces itself without migration
Infant Mortality Rate (IMR)
Deaths of children under 1 year per 1,000 live births
Life Expectancy
Average number of years a newborn is expected to live at current mortality rates
Age–Sex Pyramid
Graphical model showing population composition by age group and sex
Demographic Transition Model (DTM)
Model describing how birth and death rates change as a country develops through stages
Dependency Ratio
Ratio of dependents (under 15 + over 65) to working-age population (15–64)
Population Momentum
Continued population growth even after fertility declines, due to a large young cohort entering reproductive years
Anti-natalist Policy
Government policy designed to reduce birth rates and slow population growth
Pro-natalist Policy
Government policy designed to increase birth rates and boost population growth
Biocapacity
Earth's ability to regenerate natural resources and absorb waste
Planetary Boundaries
Ecological limits within which humanity can safely operate (Rockström et al.)
Exam Preparation
Key Takeaways & Exam Tips
📝 Paper 1 — Case Study Skills
Identify the country's DTM stage — where is it on the transition?
Read the age–sex pyramid — expanding, stationary, or contracting?
Calculate NIR and doubling time from given CBR/CDR data
Link to policy context — are there anti-natalist or pro-natalist policies?
📝 Paper 2 — Structured Essay Tips
Define key terms — "The CBR is the number of live births per 1,000 people per year…"
Use specific data — "Niger's TFR is 5.1, compared to Japan's 1.2"
Compare and contrast — anti-natalist vs pro-natalist, direct vs indirect management
Evaluate with perspectives — technocentric (policy solutions) vs ecocentric (carrying capacity)
HL students: always consider population momentum and dependency ratios in your analysis
Anti-natalist vs pro-natalist; ethical trade-offs; success metrics
Discuss DTM stages
Link to healthcare, education, urbanisation, economic development
HL: Population momentum
Explain why growth continues after TFR drops
HL: Earth systems stress
Link population growth to biocapacity, planetary boundaries, doughnut model
✅
You've Covered All 10 Syllabus Points
10
Understanding points completed
8.1.1 – 8.1.8 (SL) + 8.1.9 – 8.1.10 (HL)
IB ESS 8.1 — Human Populations Dynamics New Syllabus · First Assessment 2026 Understanding how populations grow is the first step to managing them sustainably.